The Search Engine Referral Report: Google's Grip Holds as ChatGPT Referrals Break Out
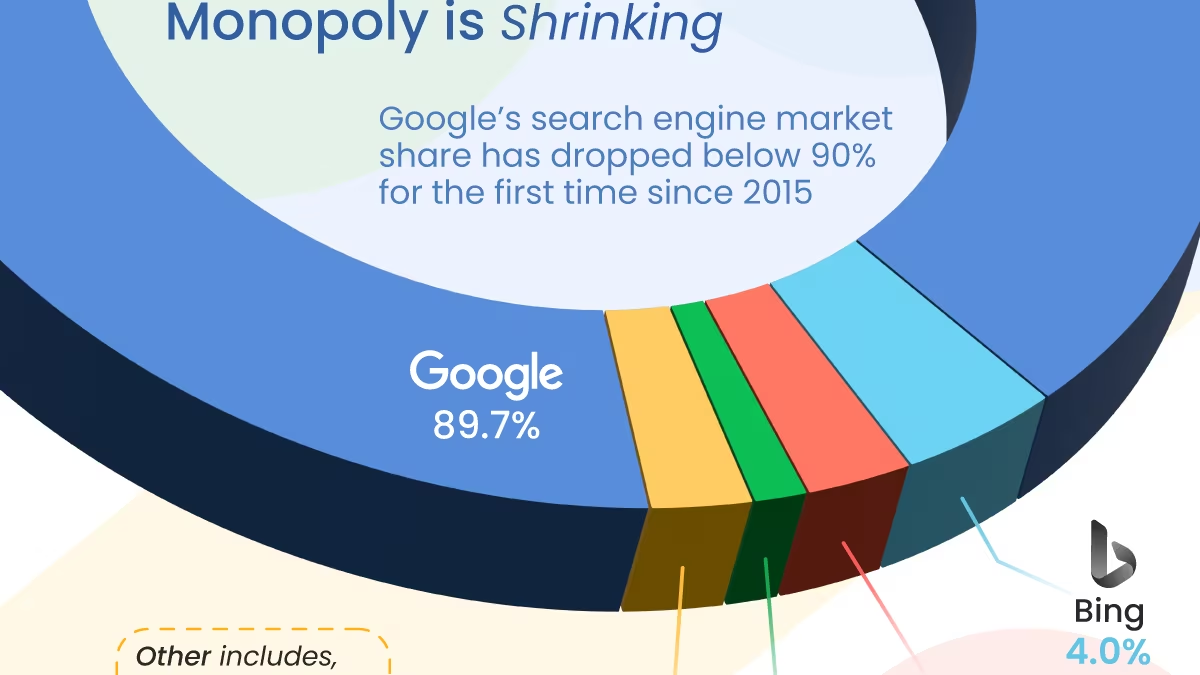
📊 Stats Alert: Google generates 88.1% of all web referral traffic and 91.6% of search-engine-only referrals — essentially flat month-over-month after six months of tightening. The breakout story is ChatGPT: chatgpt.com referrals hit 1.05%, a 3.5x jump in one month and ~5.5x since January, making it the largest AI referrer and the #6 referring domain on the web. In lockstep, OpenAI's crawl-to-refer ratio collapsed from 1,284:1 in January to 217:1. Anthropic's Claude-User is now the #2 bot on the entire web (10.1%), and the three AI bot categories combined (35.4%) have overtaken search-engine crawlers (26.2%) for the first time. TikTok kept sliding to 2.4%.
When I first published this report in February on January 2026 data, the headline was Google's overwhelming 81.6% referral share and TikTok's surprise turn as the second-largest referrer. Six editions later, two things have changed the story. First, Google's tightening has stopped — its referral share has plateaued near 88%, even ticking down a hair this month. Second, and far more consequential, AI search has finally shown up as real referral traffic, not just crawling. ChatGPT's referral share more than tripled in a single month while OpenAI's crawl-to-refer ratio fell almost exactly in proportion — two independent metrics telling the same story. I re-ran the Cloudflare Radar queries against the latest 28 days — June 23 through July 21, 2026 — against the preceding 28-day window, and the AI-referral inflection is the clearest signal in the dataset.
💡 Author note from James Bennett: I update this report alongside the June AI Crawler Report, because the two are two halves of one ledger: the crawler report measures what AI bots take, and this one measures what they give back. This month those halves finally moved together. The crawler report documented Anthropic scaling both its training crawler (ClaudeBot, now #2 at 20.0%) and its search crawler (Claude-SearchBot); on the referral side, that same operator now runs the #2 bot on the entire web (Claude-User) and is the #3 bot operator overall. When OpenAI's referral share tripled, I didn't have to trust the referral number alone — its crawl-to-refer ratio dropped by an almost identical factor, an independent confirmation from a separate endpoint. That kind of cross-check is exactly why I re-query the raw API every edition instead of restating last month's numbers.
How Much of All Web Referral Traffic Does Google Control?
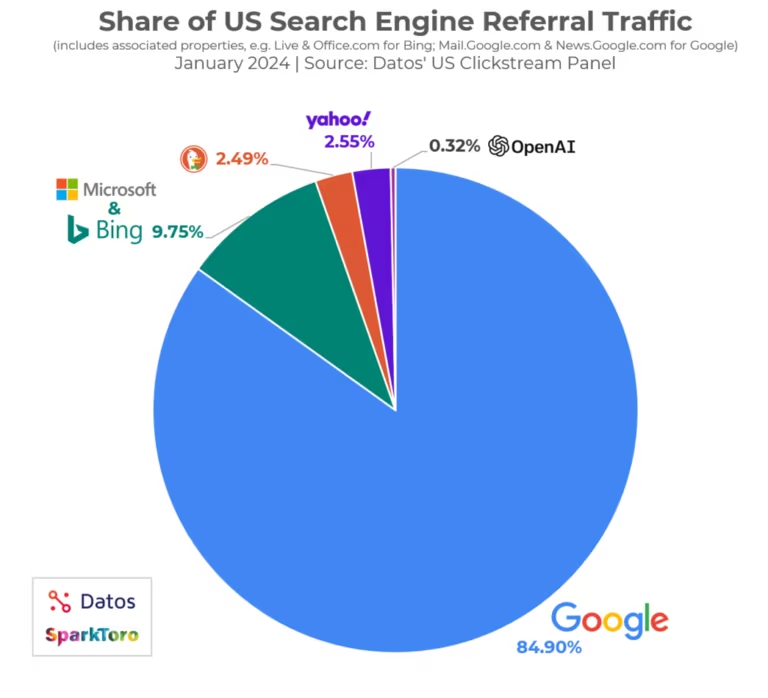
According to Cloudflare Radar web crawler referral data (/radar/bots/crawlers/summary/REFERER endpoint), Google properties now generate 88.1% of all identified referral traffic globally. That is up +6.6 percentage points from 81.6% in January — but the six-month climb has flattened: month-over-month, Google actually slipped -0.16 pp (88.30% → 88.15%). After two quarters of relentless tightening, Google's referral grip has reached a plateau rather than a new peak.
| Referral Source | July 2026 Share (%) | January 2026 Share (%) | Category |
|---|---|---|---|
| google.* | 88.15% | 81.58% | Search Engine |
| bing.com | 3.10% | 2.81% | Search Engine |
| tiktok.com | 2.43% | 10.59% | Social / Discovery |
| yandex.* | 1.77% | 1.62% | Search Engine |
| duckduckgo.com | 1.26% | 1.18% | Search Engine |
| chatgpt.com | 1.05% | 0.19% | AI Search |
| m.baidu.com | 0.89% | 1.39% | Search Engine |
| cn.bing.com | 0.61% | 0.14% | Search Engine |
| baidu.com | 0.46% | 0.36% | Search Engine |
gemini.google.com, claude.ai, perplexity.ai, and scholar.google.* remain in the sub-0.05% long tail (collapsed into "other"); each is still a rounding-error referrer next to chatgpt.com.
When I strip out non-search referrers like TikTok and isolate only traditional search engines, Google's share rises to approximately 91.6% of all search-engine referral traffic — up marginally from 90.9% in the prior edition. Among every 100 visitors a website receives from a search engine, roughly 92 still come from Google.
The most important shift is no longer at the top of the table — it's at position #6. chatgpt.com has broken out of the long tail, and I've given it its own section below because it's the clearest inflection in the whole dataset. Elsewhere: Bing (combining bing.com + cn.bing.com) sits at 3.71% and holds the #2 search-referrer spot, boosted by an unusual jump in cn.bing.com (0.14% → 0.61%). TikTok kept sliding. The Baidu properties softened to a combined 1.35%.
💡 Expert Insight from James Bennett (Lead Engineer, WebSearchAPI.ai):
The number I'd internalize from this table is that Google's tightening has a ceiling, and we may have just hit it. For six months the story was "Google's grip keeps closing"; this month it opened a fraction. That doesn't mean Google is weakening — 88% referral share with 91.6% of search-engine referrals is total dominance by any definition — but it does mean the incremental gains are now coming from elsewhere. When I plan retrieval strategy, I still treat Google as effectively the entire organic-search surface. What changed this quarter is that the "everything else" bucket finally has a name worth watching in it: ChatGPT. For the first time, optimizing for a non-Google referrer clears the threshold of being worth the engineering time.
Has ChatGPT Finally Become a Real Referral Source?
Yes — and this is the single most important change in the July data. chatgpt.com referrals surged to 1.05% of all identified referral traffic, up from 0.30% last month (a 3.5x month-over-month jump) and 0.19% in January (~5.5x over the half-year). ChatGPT is now the largest AI referrer by a factor of more than 20x, the #6 referring domain overall — ahead of every Baidu property, ahead of cn.bing.com, and closing on DuckDuckGo (1.26%).
What makes this more than a one-month blip is that a completely separate Radar endpoint corroborates it. OpenAI's crawl-to-refer ratio collapsed from 820:1 last month to 217:1 this month (and from 1,284:1 in January). If ChatGPT's crawl volume stayed roughly flat while its referrals tripled, its crawl-to-refer ratio should fall by roughly the same factor — and it did: 820 ÷ 217 ≈ 3.8x, almost exactly matching the 3.5x referral jump. Two endpoints, one story. This isn't measurement noise; ChatGPT Search is surfacing source links to users materially more often than it was a month ago.
| AI Referrer | July 2026 | June 2026 | January 2026 | Half-Year Change |
|---|---|---|---|---|
| chatgpt.com | 1.05% | 0.30% | 0.19% | +453% |
| gemini.google.com | <0.05% | <0.05% | <0.05% | Long tail |
| perplexity.ai | <0.05% | <0.05% | <0.05% | Long tail |
| claude.ai | <0.05% | <0.05% | <0.05% | Long tail |
The rest of the AI-search field has not followed. Gemini, Perplexity, and Claude.ai all remain in the sub-0.05% long tail — present in the data, but not yet sending measurable referral traffic the way ChatGPT now is. For the moment, "AI referral traffic" and "ChatGPT referral traffic" are nearly synonymous.
📈 Case Study:
Eighteen months ago, no AI product sent a measurable fraction of referral traffic to the open web. Today, a single one — ChatGPT — is the sixth-largest referring domain on the internet and growing faster than any source in this report. If you're building applications on top of real-time web data, the retrieval layer underneath this shift is the thing to understand first; I break down the complete picture in my guide on what a web search API is and why it matters for AI agents.
💡 Expert Insight from James Bennett:
The reason I trust the ChatGPT number is the cross-check, and I'd encourage anyone reading a surprising stat to demand the same. A 3.5x month-over-month move on a single metric is exactly the kind of thing that turns out to be a parsing artifact or a re-classification. What convinced me it's real is that the crawl-to-refer ratio — computed from a different endpoint, with a different denominator — moved by a matching factor in the matching direction. When two independent measurements of the same underlying behavior agree, you're looking at a real change in the world, not a change in how it was counted. Practically, this is the first quarter I'd tell a content team it's worth checking whether ChatGPT Search cites them, and to make sure the pages it would want to cite are actually reachable — because the click-through is finally non-trivial.
What Happened to TikTok as a Referral Source?
TikTok's long slide continued. After collapsing from 10.59% in January to 3.25% in the spring, TikTok's referral share fell again to 2.43% — down from 2.93% last month. The "TikTok has stabilized" read from the prior edition did not hold: it kept drifting lower, and is now down 77% from its January level. Bing (3.71% combined) has extended its lead as the clear #2 referrer.
| Referral Source | July 2026 Share (%) | January 2026 Share (%) | Change (pp) | Relative Change |
|---|---|---|---|---|
| Bing (all variants) | 3.71% | 2.95% | +0.76 | +25.8% |
| TikTok | 2.43% | 10.59% | -8.16 | -77.1% |
| Yandex | 1.77% | 1.62% | +0.15 | +9.3% |
| Baidu (all variants) | 1.35% | 1.75% | -0.40 | -22.9% |
| DuckDuckGo | 1.26% | 1.18% | +0.08 | +6.8% |
The explanation I gave last quarter still holds and has, if anything, been reinforced by the continued decline. Two mechanisms are operating at once:
- In-app browser tightening. TikTok's early-2026 update more aggressively keeps users inside its in-app browser when tapping bio links, so fewer taps spawn external browser sessions that generate identifiable referrer headers. Real link clicks may still happen — they just stop being visible to Cloudflare as TikTok referrers.
- Referrer policy changes. TikTok moved more outbound clicks to a
noreferrerpolicy, systematically stripping theRefererheader — the same shift most major social platforms made between 2019 and 2022.
The takeaway for site owners is unchanged: TikTok's measured referral share is structurally lower regardless of actual click volume. Read the 2.43% figure as a floor on identifiable TikTok-driven traffic, not a measure of TikTok's real user engagement.
💡 Expert Insight from James Bennett (Lead Engineer, WebSearchAPI.ai):
The instructive contrast this month is TikTok versus ChatGPT. TikTok is a platform whose measured referrals are falling largely because of how it labels outbound traffic; ChatGPT is a platform whose measured referrals are rising because it started surfacing source links. Same metric, opposite drivers — and neither is fully explained by "how many people clicked." The lesson I keep relearning from this dataset is that referrer share measures the intersection of user behavior and platform labeling policy, and you can't separate the two from the outside. When a number moves, ask which one changed before you rewrite your strategy around it.
How Has Google's Referral Dominance Changed Month Over Month?
Comparing the current 28-day window (June 23 – July 21, 2026) against the immediately preceding one (May 26 – June 23, 2026), the top of the table is now remarkably stable — and the action has moved to the AI tier. According to Cloudflare Radar referral analytics:
| Referral Source | June 2026 | July 2026 | Change (pp) |
|---|---|---|---|
| google.* | 88.30% | 88.15% | -0.16 |
| bing.com | 3.32% | 3.10% | -0.22 |
| tiktok.com | 2.93% | 2.43% | -0.50 |
| yandex.* | 1.86% | 1.77% | -0.08 |
| duckduckgo.com | 1.38% | 1.26% | -0.13 |
| chatgpt.com | 0.30% | 1.05% | +0.76 |
| m.baidu.com | 1.03% | 0.89% | -0.14 |
| cn.bing.com | 0.14% | 0.61% | +0.47 |
| baidu.com | 0.54% | 0.46% | -0.08 |
The pattern is striking: almost every established referrer ticked down slightly, and the two gainers were both non-traditional — chatgpt.com (+0.76 pp) and cn.bing.com (+0.47 pp). Google's -0.16 pp dip is small but notable: it's the first month-over-month decline in Google's referral share I've recorded since I began tracking this metric. This is what a plateau looks like — not a reversal, but the end of the relentless one-directional tightening that defined the first half of the year.
The chatgpt.com line is the one to watch. A +0.76 pp gain in a single month, on a base that was 0.19% in January, is the fastest proportional move any referrer has posted in the life of this report. I'll return to what this means for crawl-to-refer economics in the next two sections.
💡 Expert Insight from James Bennett:
When the incumbents all drift down together by small amounts and one challenger jumps, that's usually a denominator effect plus a real signal layered on top. Part of chatgpt.com's rise is that everyone else gave up a little share; most of it is genuine growth in ChatGPT surfacing links. Disentangling those is why I keep the raw percentages rather than only reporting ranks — a rank change can hide whether the leader fell or the challenger rose. Here it's clearly the challenger rising: chatgpt.com more than tripled in absolute terms, which no denominator shuffle can manufacture.
Which Search Engines Crawl the Most Relative to What They Send Back?
This is where the crawl-vs-refer economics get sharp. Cloudflare Radar tracks crawl-to-refer ratios (/radar/bots/crawlers/summary/CRAWL_REFER_RATIO endpoint) — how many crawl requests each operator makes for every referral it sends back to websites. A lower ratio means the operator is more "generous": it returns traffic relative to the content it consumes.
| Operator | July 2026 Ratio | June 2026 Ratio | January 2026 Ratio | Direction |
|---|---|---|---|---|
| DuckDuckGo | 2.5:1 | 1.9:1 | 1.4:1 | Slightly worse |
| 4.6:1 | 5.2:1 | 4.9:1 | Flat / best-in-class | |
| ByteDance/TikTok | 10.9:1 | 9.7:1 | 2.6:1 | Worse |
| Baidu | 11.8:1 | 10.3:1 | 4.1:1 | Worse |
| Yandex | 26.3:1 | 25.5:1 | 16.1:1 | Worse |
| Microsoft/Bing | 34.8:1 | 34.5:1 | 34.2:1 | Flat |
| OpenAI | 217:1 | 821:1 | 1,284:1 | Sharply improved |
| Perplexity | 224:1 | 190:1 | 113.7:1 | Worse |
| Anthropic | ~2,237:1 | ~4,039:1 | 43,214:1 | Improved again |
| Mistral | ~3,258:1 | ~105:1 | 21.9:1 | Blew out (new worst) |
Two of the biggest stories in this whole report live in this table.
OpenAI's ratio collapsed to 217:1 — from 821:1 last month and 1,284:1 in January. This is the referral surge showing up from the other side: more chatgpt.com referrals against roughly flat crawl volume mechanically drives the ratio down. OpenAI is now more efficient than Perplexity (224:1) for the first time — a milestone that would have looked impossible when OpenAI sat above 1,200:1 at the start of the year.
Anthropic improved again to roughly 2,237:1 — from ~4,039:1 last month and 43,214:1 in January, a ~19x improvement across the half-year. That's consistent with the June AI Crawler Report, which found Claude-SearchBot rising to 3.3% as the largest dedicated AI search crawler on the web: search-purpose bots generate referrals; training-purpose bots don't. Critically, Anthropic is no longer the worst operator in this table — for the first time since I began tracking it, something else is.
That something is Mistral, whose ratio blew out to roughly 3,258:1 from ~105:1 last month. Mistral is now crawling aggressively while sending almost nothing back, overtaking Anthropic as the least efficient referrer in the dataset. I'd treat this specific number with more caution than the others — a ~30x single-month move on a smaller operator is the kind of spike that can partly reverse (the June AI Crawler Report documents several "spiked then reverted" bots this year). But the direction is unambiguous: Mistral is the new name to watch on your origin logs.
At the efficient end, DuckDuckGo remains the best referrer on the web at 2.5:1, though it has drifted from 1.4:1 in January. Google holds a best-in-class 4.6:1 — right in the ~5:1 range it has occupied all year — as competitors' ratios swing wildly, Google's index/refer machinery runs in steady state.
⚠️ Warning: If you run a content-heavy website, audit your server logs for AI crawler traffic — but audit with the new order in mind. The extreme end of this table has reshuffled: Mistral (~3,258:1) is now the least efficient operator, Anthropic (~2,237:1) has improved but is still extreme, and OpenAI (217:1) has fallen far enough that blocking it now forfeits a genuinely non-trivial referral channel. The operators worth a fresh rate-limit review this quarter are Mistral and Perplexity, both moving the wrong way. Review selective robots.txt rules and rate limits quarterly.
What Drove OpenAI's and Anthropic's Ratio Improvements?
Both improvements trace to the same structural cause: search-purpose crawling is starting to pay referral dividends, while training-purpose crawling still returns nothing.
- OpenAI: chatgpt.com referrals tripled month-over-month (0.30% → 1.05%) while GPTBot's training-crawl volume stayed broadly flat. Referrals up, crawls flat, ratio down — a clean 3.8x improvement that matches the referral jump almost exactly.
- Anthropic: Claude-SearchBot (search) kept growing while ClaudeBot (training) drove crawl volume — but the referral denominator grew faster than the crawl numerator, extending the year-long improvement from 43,214:1 to ~2,237:1.
The through-line: the operators whose ratios are improving are the ones whose search crawlers are scaling. Pure training crawlers (Mistral's, apparently) that don't refer are the ones whose ratios blow out. This is the clearest data-backed case yet for treating training and search crawlers differently in your bot policy.
💡 Expert Insight from James Bennett:
A 217:1 ratio is still lopsided — a publisher gets back one visitor for every ~217 pages OpenAI crawls — but the direction is what matters, and the direction is a five-fold improvement in six months. I read the crawl-to-refer ratio as a fairness ledger: it's the single most honest number for whether an AI operator is a fair exchange or a pure extractor. What this quarter shows is that the ledger can move fast once an operator starts citing sources — OpenAI went from "pure extractor" territory toward "expensive but real search engine" territory in two quarters. If your robots.txt still blocks OAI-SearchBot the way it blocks GPTBot, you're now leaving measurable referral traffic on the table. Separate the two.
How Are Websites Responding to All This Crawler Traffic?
Here's a breakdown I haven't published before, and it reframes the whole "should I block crawlers?" debate: the web is already refusing more than a quarter of all crawler requests. Cloudflare Radar exposes the HTTP status codes that crawlers receive (/radar/bots/crawlers/summary/RESPONSE_STATUS endpoint), and the picture is far more adversarial than most site owners realize.
| Response Status | July 2026 Share (%) | June 2026 Share (%) | What It Means |
|---|---|---|---|
| 200 OK | 45.97% | 45.46% | Request served |
| 403 Forbidden | 20.65% | 21.58% | Actively blocked |
| 301 Moved | 8.04% | 7.66% | Permanent redirect |
| 404 Not Found | 7.81% | 7.11% | Dead URL |
| 429 Too Many Requests | 6.07% | 6.70% | Rate-limited |
| 302 Found | 4.63% | 4.53% | Temporary redirect |
| 204 No Content | 1.60% | 1.54% | Empty response |
| 503 Unavailable | 1.28% | 1.43% | Server overloaded / gated |
| 304 Not Modified | 1.17% | 1.19% | Cached, unchanged |
Only 46% of crawler requests get a clean 200 OK. More than one in five (20.65%) is met with a 403 Forbidden — an outright block — and another 6.07% gets a 429 Too Many Requests rate-limit. Add those together and 26.7% of all crawler requests are actively refused. Layer on the 7.81% hitting dead 404s, and well over half of crawler effort (54%) never reaches a served page.
The month-over-month move is quietly interesting: the refusal rate ticked down (28.3% → 26.7% for 403+429 combined), even as total crawler volume rose. Two readings are plausible: crawlers are getting marginally better at honoring the rate limits and blocks they hit, or site owners eased a fraction of their most aggressive gating. Either way, the headline stands — a huge share of crawling is spent getting turned away.
🎯 Key Takeaway: If you've been wondering whether it's worth configuring bot rules, this breakdown answers it: the rest of the web already has. A 403/429 refusal rate near 27% means blocking and rate-limiting crawlers is now the default posture of a large slice of the internet, not an edge case. The strategic question isn't "should I gate crawlers?" — it's "am I gating the right ones?" Refusing a training crawler that never refers costs you nothing; refusing a search crawler that's starting to send real traffic (OAI-SearchBot, Claude-SearchBot) costs you referrals. Precision matters more than posture.
💡 Expert Insight from James Bennett:
The 46% clean-hit rate is the number I'd put in front of anyone who still thinks of crawler management as optional. Half of all crawler traffic is friction — blocks, rate limits, redirects, and dead links — and that friction is a cost both sides pay: the crawler wastes budget, and your origin wastes cycles serving 403s. At WebSearchAPI.ai the operational lesson is that a clean, correct 200-or-deny decision at the edge is cheaper than letting ambiguous crawler traffic reach your application, and it's why response-status distribution is one of the first things I'd instrument on any content origin. You can't manage what you don't measure, and most teams have never looked at what status codes their crawlers are actually getting.
Who Dominates the Bot Traffic Hitting Your Site?
Search engine crawlers now represent 26.2% of all verified bot traffic globally — down from 33% at the start of the year — while the AI categories have surged past them (more on that below). According to Cloudflare Radar bot data (/radar/bots/summary/BOT endpoint), the individual crawler leaderboard has been rewritten:
| Bot | July 2026 Share of All Verified Bot Traffic (%) | Operator |
|---|---|---|
| GoogleBot | 12.97% | |
| Claude-User | 10.11% | Anthropic |
| Meta-ExternalAgent | 6.35% | Meta |
| GPTBot | 5.38% | OpenAI |
| BingBot | 4.93% | Microsoft |
| Google AdsBot | 3.68% | |
| FacebookExternalHit | 3.55% | Meta |
| Applebot | 3.38% | Apple |
| Amazonbot | 3.32% | Amazon |
The headline is Claude-User rocketing to #2 at 10.11% — the second-most-common verified bot on the entire web, behind only GoogleBot (which itself fell from 15.9% to 12.97%). Claude-User is worth understanding precisely, because it's easy to confuse with Anthropic's other two crawlers:
- ClaudeBot — training crawler (the #2 AI crawler at 20.0% in the June report).
- Claude-SearchBot — search crawler that fetches pages to answer live queries (3.3%, the largest dedicated AI search crawler).
- Claude-User — the user-triggered agent: when a person asks Claude to read or act on a specific URL, Claude-User fetches it in real time.
That third category is exploding because it maps directly to how people now use AI assistants — pasting a link and asking "summarize this" or "what does this page say?" Every one of those is a real, human-initiated fetch. Claude-User's jump from 8.68% to 10.11% in a single month is the referral-side echo of the AI-assistant usage boom, and it's why Cloudflare added a dedicated AI Assistant bot category (more on that shortly).
When you add Google's full footprint (GoogleBot + AdsBot + image/video bots), Google still represents roughly 18–20% of all bot traffic. But the concentration story now has a second protagonist: Anthropic. Between Claude-User, ClaudeBot, and Claude-SearchBot, Anthropic's crawlers collectively rival Google's on many origins — a structural change I break down in the next section.
Which Companies Own the Most Bot Traffic?
Individual bot names undersell how concentrated the ecosystem is, because big companies run several crawlers each. Rolling every bot up to its parent operator (/radar/bots/summary/BOT_OPERATOR endpoint) shows the real ownership picture — and a new #3.
| Operator | July 2026 Share (%) | June 2026 Share (%) | Change (pp) |
|---|---|---|---|
| 27.10% | 29.21% | -2.11 | |
| Meta | 13.28% | 13.40% | -0.12 |
| Anthropic | 12.03% | 10.49% | +1.54 |
| OpenAI | 6.79% | 7.03% | -0.24 |
| Microsoft | 5.38% | 5.19% | +0.19 |
| Amazon | 4.75% | 4.07% | +0.68 |
| Apple | 3.39% | 3.76% | -0.37 |
| Ahrefs | 3.33% | 3.17% | +0.16 |
| Baidu | 3.05% | 2.88% | +0.17 |
Anthropic is now the #3 bot operator on the web at 12.03% — up +1.54 pp in a month, and nearly double OpenAI's 6.79%. A year ago Anthropic barely registered on operator-level bot rankings; today only Google (27.10%) and Meta (13.28%) run more bot traffic. Google, meanwhile, gave back -2.11 pp — the same plateau-and-soften pattern visible in its referral share.
The top four operators — Google, Meta, Anthropic, and OpenAI — now account for 59.2% of all verified bot traffic. The concentration itself isn't new; what's new is who's in the top four. Two of those four (Anthropic, OpenAI) are AI-native companies that didn't run meaningful crawler fleets 18 months ago. The bot ecosystem is consolidating around AI operators even as it stays consolidated overall.
💡 Expert Insight from James Bennett:
The operator view is the one I'd actually build bot policy around, because your robots.txt and rate limits are enforced per-operator in practice, not per-individual-bot. Seeing Anthropic at 12% and nearly double OpenAI reframes the whole "which AI company matters" question — a year of headlines centered on OpenAI, but on the wire, Anthropic is now the larger crawler by a wide margin, running three distinct bots (training, search, and user-triggered) at once. If you're deciding where to spend your limited bot-management attention, "block or allow, per operator, with training-vs-search granularity" is the decision that matters, and Anthropic is the operator whose footprint changed most this quarter.
What Does the Full Bot Ecosystem Look Like?
According to Cloudflare Radar's client-type analytics (/radar/bots/crawlers/summary/CLIENT_TYPE endpoint), the bot-vs-human split kept widening:
| Client Type | July 2026 Share (%) | January 2026 Share (%) | Change (pp) |
|---|---|---|---|
| Non-AI Bot | 48.65% | 43.54% | +5.11 |
| Human | 42.35% | 47.31% | -4.96 |
| AI Bot | 5.71% | 5.06% | +0.65 |
| Mixed Purpose | 3.29% | 4.10% | -0.81 |
Bots now outnumber humans 57.7% to 42.3% — and the gap widened again, with human share falling nearly 5 pp since January. The growth came mostly from non-AI bots (SEO scanners, page-preview bots, ad bots) and, increasingly, AI bots.
The most consequential shift is in the category breakdown (/radar/bots/summary/BOT_CATEGORY), where a crossover I've been forecasting for two quarters has now happened:
| Bot Category | July 2026 Share (%) | June 2026 Share (%) | Change (pp) |
|---|---|---|---|
| Search Engine Crawler | 26.18% | 27.30% | -1.12 |
| AI Crawler | 17.86% | 17.67% | +0.19 |
| SEO Tools | 11.78% | 12.43% | -0.65 |
| AI Assistant | 10.93% | 9.53% | +1.40 |
| Advertising & Marketing | 7.78% | 7.53% | +0.25 |
| AI Search | 6.63% | 6.21% | +0.42 |
| Page Preview | 6.22% | 7.00% | -0.78 |
| Webhooks | 5.19% | 4.71% | +0.48 |
| Monitoring & Analytics | 3.33% | 3.26% | +0.07 |
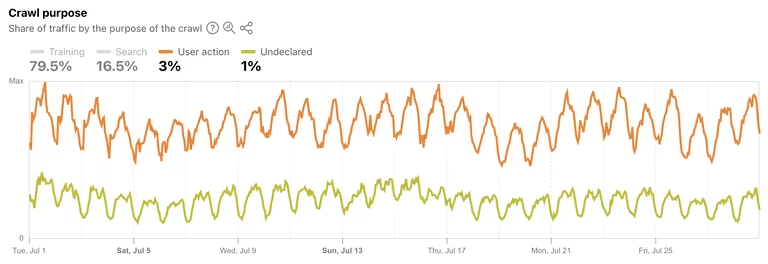
Sum the three AI categories — AI Crawler (17.86%) + AI Assistant (10.93%) + AI Search (6.63%) — and you reach 35.4% of all verified bot traffic, decisively ahead of Search Engine Crawlers at 26.2%. For the first time, AI-purpose bots are the largest class of automated traffic on the web, leading traditional search indexing by more than 9 percentage points. The crossover I flagged as "on a clear trajectory to happen this year" in the spring edition has arrived.
⚠️ Methodology note: Cloudflare introduced the AI Assistant category this period to separate user-triggered AI fetches (Claude-User, ChatGPT-User) from bulk AI Crawler training traffic. Some volume that previously counted as "AI Crawler" now counts as "AI Assistant." Read AI Crawler's roughly-flat month (+0.19 pp) as a reclassification effect, not a decline — the underlying AI traffic grew; it was simply split into a more meaningful taxonomy. This is why I compare the category table month-over-month (identical taxonomy) rather than against January, whose categories predate the AI Assistant split.
🎯 Key Takeaway: The mental model of "search bots vs. everything else" is now two full quarters out of date. There are three distinct AI bot classes hitting your origin — training crawlers (bulk ingestion, no referrals), search crawlers (real-time fetch to cite a source, growing referrals), and user-triggered assistants (a human asked an AI to read your page right now). They deserve three different policies. Lumping them together either blocks referrals you want or admits training you'd rather rate-limit.
💡 Expert Insight from James Bennett:
The AI Assistant category is the one I find most operationally important, because it's the only bot class where a real human is waiting on the other end. When Claude-User or ChatGPT-User hits your page, someone just asked an assistant to read it — throttling that request degrades a live user experience in a way that throttling a training crawler never does. My rule of thumb: training crawlers can absorb aggressive rate limits, search crawlers should get headroom because they cite you, and user-triggered assistants should be treated almost like human traffic because functionally they are. The new category finally makes that distinction visible in the data; your bot policy should make it visible in your config.
How Does Google's Browser Dominance Reinforce Its Search Monopoly?
Chrome controls 70.9% of all browser traffic globally — and it actually ticked up this quarter, reversing the slight dip in the spring — according to Cloudflare Radar HTTP analytics (/radar/http/summary/browser_family endpoint). The Firefox mini-resurgence I noted last edition unwound: Firefox gave back its gains, falling to 4.19%.
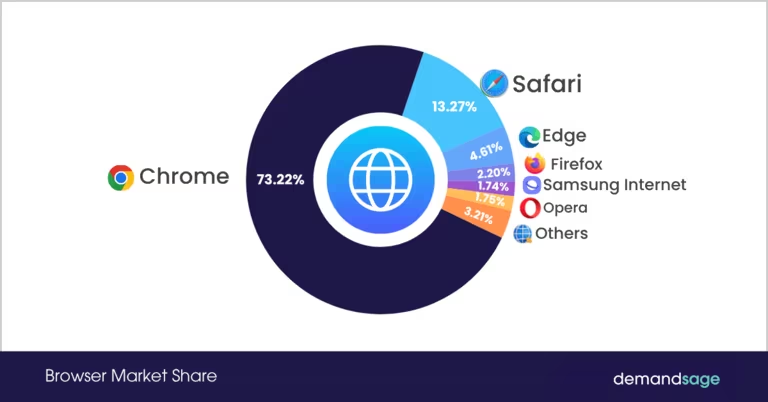
| Browser | July 2026 Share (%) | January 2026 Share (%) | Change (pp) |
|---|---|---|---|
| Chrome | 70.92% | 70.15% | +0.77 |
| Safari | 15.84% | 16.64% | -0.80 |
| Edge | 5.76% | 5.82% | -0.06 |
| Firefox | 4.19% | 3.95% | +0.24 |
| Samsung | 1.81% | 1.84% | -0.03 |
| Opera | 1.26% | 1.36% | -0.10 |
Chrome's default search engine is Google. Safari's default is Google (through a deal worth an estimated $20 billion annually, as revealed in the DOJ antitrust trial). Combined, Chrome and Safari — 86.8% of all browser traffic — still default to Google search, up from ~86.0% last quarter. The one soft spot in Google's browser distribution (Firefox) narrowed rather than widened this period.
| Google Ecosystem Control Point | July 2026 | January 2026 | Direction |
|---|---|---|---|
| Search referral traffic | 88.1% | 81.6% | Tighter, now plateaued |
| Search engine referrals (search-only) | 91.6% | 91.2% | Flat |
| GoogleBot share of all bot traffic | 13.0% | 15.9% | Softer |
| Browser market (Chrome) | 70.9% | 70.1% | Slightly tighter |
| Browsers defaulting to Google search | ~86.8% | ~86.8% | Flat |
| #1 most popular domain globally | google.com | google.com | Unchanged |
The pieces still reinforce each other — Chrome funnels users to Google search, Google search generates referrals, Googlebot crawls to index for those searches. What changed in H1 2026 is that the incremental pressure moved off Google and onto the AI layer. Google's own share has stopped climbing; the growth is now in AI assistants and AI search, which sit alongside Google rather than displacing it.
Which Industries Receive the Most Crawler and Referral Traffic?
According to Cloudflare Radar crawler analytics (/radar/bots/crawlers/summary/VERTICAL endpoint), Shopping re-accelerated after its spring cooldown and widened its lead as the most-crawled vertical.
| Industry Vertical | July 2026 Share (%) | January 2026 Share (%) | Change (pp) |
|---|---|---|---|
| Shopping & General Merchandise | 26.41% | 22.93% | +3.48 |
| Internet and Telecom | 20.55% | 22.58% | -2.03 |
| Computer and Electronics | 18.79% | 19.41% | -0.62 |
| News, Media, and Publications | 9.15% | 8.37% | +0.78 |
| Gambling | 6.69% | 6.92% | -0.23 |
| Business and Industry | 3.57% | 3.77% | -0.20 |
| Professional Services | 2.72% | 2.74% | -0.02 |
| Finance | 2.55% | 2.93% | -0.38 |
| Games | 2.26% | 2.43% | -0.17 |
Shopping & General Merchandise is the most-crawled vertical at 26.41% — and after cooling to ~25% in the spring, it climbed back up and stretched its lead over Internet & Telecom to nearly 6 pp. The retail-content crawl pressure that looked like it was normalizing has resumed. News, Media & Publications continued its steady climb to 9.15%, consistent with the rise in real-time AI-search and AI-assistant fetches, which favor fresh news and reference content over static catalogs.
If you run an e-commerce site, you remain in the single most-crawled vertical on the web, and the pressure is rising again rather than easing. If you run news or media, the multi-quarter uptrend in your vertical is the clearest sign that AI retrieval is redirecting crawl attention toward freshness — plan cache and recrawl budgets accordingly.
💡 Expert Insight from James Bennett:
Shopping re-accelerating to 26% is the correction to my spring read, and I'd rather flag the miss than bury it: I called the Q1 shopping surge "past its high-water mark," and it wasn't. The re-acceleration lines up with AI shopping assistants maturing — price comparison, review synthesis, and deal-finding are exactly the query types that send an assistant to crawl a lot of product pages in real time. The News/Media uptick is the trend I'm now most confident about, because it's monotonic across every edition this year: as retrieval-purpose crawling grows, freshness expectations on editorial content keep ratcheting up. If your content has a shelf life, the crawlers are visiting more often than they were a quarter ago.
What Does AI Search Look Like Compared to Traditional Search?
Pulling the threads together: AI-purpose bots (crawler + assistant + search) are now 35.4% of verified bot traffic and have overtaken traditional search crawlers. Within that, AI Search sits at 6.63% and AI-search crawling reached roughly 11% of all AI-bot activity this window (/radar/ai/bots/summary/CRAWL_PURPOSE) — a record, and consistent with the June AI Crawler Report's 10.5% reading on its own window.
The composition keeps consolidating around Anthropic and OpenAI. The June crawler report showed Anthropic's Claude-SearchBot at 3.3%, the largest dedicated AI search crawler, while OpenAI runs OAI-SearchBot for ChatGPT Search — and on the referral side, chatgpt.com just broke out to 1.05%. The four most consequential AI operators today:
| Operator | Key User Agents | July 2026 Signal |
|---|---|---|
| Anthropic | Claude-SearchBot, Claude-User, ClaudeBot | #2 bot on the web (Claude-User 10.1%); largest AI search crawler (3.3%) |
| OpenAI | OAI-SearchBot, ChatGPT-User, GPTBot | chatgpt.com referrals broke out to 1.05%; ratio collapsed to 217:1 |
| Googlebot (mixed) | Powers AI Overviews & Gemini; gemini.google.com still in the long tail | |
| Perplexity | PerplexityBot | perplexity.ai in the long tail; crawl-to-refer worsening (224:1) |
The gap between AI's bot-side footprint and its referral-side payoff is still enormous — AI Search is 6.63% of bot traffic but AI referrers (chatgpt.com plus the long tail) sum to roughly 1.1% of referrals. But that gap is closing from the OpenAI corner specifically, and fast. A quarter ago the entire AI-referral footprint was a rounding error; today one operator alone sends more than 1% of all web referrals.
💡 Expert Insight from James Bennett:
The distinction I'd hold onto is that "AI is 35% of bot traffic" and "AI is ~1% of referral traffic" are both true, and the tension between them is the whole story. AI systems consume web content at massive scale and, until this quarter, returned almost nothing. What's new is that the return side finally moved — not evenly, but decisively, and from the operator (OpenAI) that made its search product surface links more aggressively. For anyone modeling crawler load on their origin, the planning guidance is unchanged: budget high on the AI-crawl side, because that's where the volume is. What changed is the upside: the referral payoff for being reachable and citable is no longer hypothetical. Being in the set of pages ChatGPT will cite is now worth measurable traffic.
What Should Website Owners Take Away From This Updated Data?
Based on the July 2026 Cloudflare Radar data, here are the implications I'd prioritize:
Google's referral dominance is total but has plateaued. At 88.1% of all referrals and 91.6% of search-engine referrals, Google is still the entire organic-search game — but its six-month tightening has stopped, and it even dipped -0.16 pp this month. Build for Google first, always; just don't assume its share keeps climbing. The incremental growth has moved to the AI layer.
ChatGPT is now a real referral source. chatgpt.com hit 1.05% — 5.5x its January level and the #6 referring domain on the web — corroborated by OpenAI's crawl-to-refer ratio collapsing to 217:1. This is the first quarter where checking whether ChatGPT Search cites you, and ensuring those pages are reachable, is worth real engineering time.
More than a quarter of crawler requests are already refused. Only 46% of crawler traffic gets a 200 OK; 20.7% gets a 403 block and 6.1% a 429 rate-limit. The web has already adopted an aggressive gating posture. The question is precision: refuse training crawlers that never refer, but give headroom to search and assistant crawlers that do.
Anthropic is now the #2 bot on the web and the #3 operator. Claude-User (10.1%) trails only GoogleBot, and Anthropic (12.0% of all bot traffic) runs nearly double OpenAI's footprint across three distinct crawlers. If your bot policy still centers on OpenAI, it's tracking last year's leader — Anthropic is the operator whose footprint changed most.
AI bots have overtaken search crawlers. The three AI categories combined (35.4%) now lead traditional search indexing (26.2%) by more than 9 pp. Adopt a three-bucket policy — training, search, and user-triggered assistant — because a single "AI bots" rule now either forfeits referrals or admits training you'd rather throttle.
TikTok kept sliding; plan around 2.4% as a measurement floor. Its continued decline is largely a labeling artifact (in-app browser + noreferrer), not necessarily a collapse in real clicks. Don't over-correct your social strategy off a number that measures header visibility as much as engagement.
Bots are 57.7% of your origin traffic. Humans fell below 43%. Your CDN config, rate limits, and bot-management policy are the primary throughput shaper for your site, not an edge case.
🎯 Key Takeaway: The story of H1 2026 isn't Google losing its grip — it's the AI ecosystem crossing from "consumes the web" to "participates in the web." AI bots overtook search crawlers, one AI referrer (ChatGPT) broke the 1% barrier, and the crawl-to-refer ledger started rewarding the operators that cite sources. Website owners who built bot policy around "search engines vs. everything else" now need three buckets — training, search, and user-triggered assistants — and a real strategy for being citable, not just crawlable.
Build Smarter Search With Us
The data in this report shows how search and AI crawling are reshaping the web in real time. Whether you're building AI applications that need real-time web data, or you want to understand how search engines and AI bots interact with your content, WebSearchAPI.ai gives you the tools to harness web intelligence through a single, fast API.
Ready to see it in action? Start building with WebSearchAPI.ai and get Google-grade results in minutes.
How I Analyzed This Data
This analysis uses data from Cloudflare Radar's crawler analytics (/radar/bots/crawlers/summary/* endpoints), bot traffic analysis (/radar/bots/summary/* endpoints), AI-bot purpose data (/radar/ai/bots/summary/*), and HTTP traffic analytics (/radar/http/summary/browser_family), which aggregate patterns across Cloudflare's global network spanning 330 cities in 125+ countries. Cloudflare's network processes over 81 million HTTP requests per second, providing one of the most comprehensive views of global internet traffic available.
I queried referral traffic by source, crawl-to-refer ratios by operator, HTTP response-status distribution for crawlers, individual bot and operator-level bot share, browser family distribution, client-type (human vs. bot) composition, bot-category composition, and industry-level crawler traffic. The current data covers the rolling 28-day window of June 23 through July 21, 2026 (dateRange=28d), with month-over-month comparisons against the immediately preceding 28-day window (May 26 – June 23, 2026, via dateRange=28dControl). Half-year comparisons reference the original report's window (January 9 – February 8, 2026).
The crawl-to-refer ratio measures how many crawl requests each operator makes relative to the referral traffic it generates. A ratio of 5:1 means the operator crawls 5 pages for every 1 referral it sends. Lower ratios indicate more efficient or generous referral behavior. All percentages represent share of identified referral, crawler, HTTP, or bot traffic — not share of total internet traffic.
⚠️ Methodology note: Two figures warrant caution. First, TikTok's measured referral share is depressed by in-app-browser and noreferrer changes that strip identifiable referrer headers — treat 2.43% as a floor on identifiable TikTok traffic, not a ceiling on total TikTok-driven clicks. Second, Mistral's ~3,258:1 crawl-to-refer ratio is a ~30x single-month spike on a smaller operator; single-window ratio moves of this magnitude can partly revert, so read it as a flag to watch, not a settled trend. The AI Crawler / AI Assistant split is a new Cloudflare taxonomy this period; some volume moved between the two, so those categories are compared month-over-month on identical definitions rather than against January.
Data source: Cloudflare Radar — /radar/bots/crawlers/summary/*, /radar/bots/summary/*, /radar/ai/bots/summary/*, and /radar/http/summary/browser_family endpoints (radar.cloudflare.com), June 23 – July 21, 2026 vs. May 26 – June 23, 2026. Last updated: July 21, 2026.
Frequently Asked Questions
What percentage of web referral traffic does Google control?
According to July 2026 Cloudflare Radar data, Google generates 88.1% of all identified web referral traffic globally — up from 81.6% in January 2026, though the climb has plateaued and even dipped slightly month-over-month. When isolating only search-engine-specific referrals (excluding non-search sources like TikTok), Google's share rises to approximately 91.6%. Google remains the overwhelmingly dominant way people discover websites through search.
How much referral traffic does ChatGPT send to websites?
As of July 2026, ChatGPT (chatgpt.com) generates 1.05% of all identified referral traffic — a 3.5x jump in one month and roughly 5.5x its January level of 0.19%. That makes it the largest AI referrer by more than 20x and the #6 referring domain on the web overall. The surge is corroborated by OpenAI's crawl-to-refer ratio collapsing from 1,284:1 in January to 217:1, an independent signal that ChatGPT Search is surfacing source links far more often. Other AI referrers (gemini.google.com, claude.ai, perplexity.ai) remain in the sub-0.05% long tail.
What happened to TikTok as a referral source?
TikTok's measured referral share fell from 10.59% in January to 2.43% in July 2026 — a 77% decline — and it is still drifting lower rather than stabilizing. The drop is driven mainly by TikTok's in-app-browser update (which keeps users inside the app instead of opening external browsers) and a broader move to noreferrer policies that strip the Referer header on outbound clicks. Bing holds the #2 referrer position at ~3.7% combined. The 2.43% figure measures identifiable TikTok-driven traffic, not necessarily total TikTok user clicks.
What is a crawl-to-refer ratio and why does it matter?
A crawl-to-refer ratio measures how many pages a bot crawls for every referral (visitor) it sends back. A ratio of 5:1 means the operator crawls 5 pages per visitor returned; lower is more generous. As of July 2026, DuckDuckGo has the best ratio at 2.5:1 and Google sits at a best-in-class 4.6:1. At the extreme end the order has reshuffled: Mistral blew out to ~3,258:1 (the new least-efficient operator), Anthropic improved to ~2,237:1, and OpenAI collapsed to 217:1 as ChatGPT referrals surged — now more efficient than Perplexity (224:1) for the first time.
How are websites responding to crawler traffic?
Aggressively. Only 46% of crawler requests receive a clean 200 OK. 20.7% are met with a 403 Forbidden (outright block) and 6.1% with a 429 Too Many Requests (rate-limit) — meaning roughly 27% of all crawler requests are actively refused. Add dead 404s and redirects, and more than half of crawler effort never reaches a served page. Blocking and rate-limiting crawlers is now the default posture of a large share of the web, so the strategic question is which crawlers to gate, not whether to gate at all.
Which company runs the most bot traffic?
Google leads at 27.1% of all verified bot traffic (rolling up GoogleBot, AdsBot, and its other crawlers), followed by Meta at 13.3% and — the surprise — Anthropic at 12.0%, now the #3 bot operator and nearly double OpenAI's 6.8%. Anthropic runs three distinct crawlers: ClaudeBot (training), Claude-SearchBot (search), and Claude-User (user-triggered), the last of which is now the #2 individual bot on the entire web at 10.1%.
Should I block AI crawlers from my website?
It depends on the crawler's purpose, and the distinction has never mattered more. Training crawlers (ClaudeBot, GPTBot, and apparently Mistral's) consume bandwidth while returning almost nothing — Mistral's ~3,258:1 and Anthropic's ~2,237:1 ratios make the case for rate-limiting them. Search crawlers (OAI-SearchBot, Claude-SearchBot, PerplexityBot) fetch pages in real time to cite sources, and their referral payoff is now measurable — OpenAI's 217:1 ratio and ChatGPT's 1.05% referral share mean blocking them forfeits real traffic. User-triggered assistants (Claude-User, ChatGPT-User) mean a human is waiting on the response and should be treated almost like human traffic. For a detailed per-crawler breakdown, see the June AI Crawler Report.
Have AI bots overtaken search engine crawlers?
Yes, as of July 2026. Summing the three AI categories — AI Crawler (17.86%), AI Assistant (10.93%), and AI Search (6.63%) — gives 35.4% of all verified bot traffic, ahead of Search Engine Crawlers at 26.2% by more than 9 percentage points. It's the first time AI-purpose bots are the largest class of automated traffic on the web. Note that Cloudflare introduced the AI Assistant category this period to separate user-triggered fetches from bulk training crawls, so the AI totals reflect both real growth and a more granular taxonomy.
How much of my website traffic is now bots vs humans?
According to Cloudflare Radar's July 2026 client-type data, verified bot traffic represents 57.7% of all identified-client traffic — outnumbering humans (42.3%), with the gap widening nearly 5 pp since January. The composition: 48.7% non-AI bots (search, SEO, ads, monitoring), 5.7% AI bots, and 3.3% mixed-purpose bots. Plan your CDN, rate-limiting, and bot-management policies on the assumption that bots are the majority of your origin traffic.
Related Resources
- Monthly AI Crawler Report: June 2026 — ClaudeBot Surges to #2 as Bytespider Reverses -- Detailed AI crawler market share, robots.txt directives, crawl-to-refer analysis, and the Q2 predictions tracker
- What is a Web Search API? Complete Guide for AI Agents and LLMs -- How web search APIs work and why they matter for AI applications
- Anthropic's Claude Web Search API Explained -- A closer look at the Claude search stack behind Claude-SearchBot and Claude-User
- Cloudflare Radar -- The primary data source for this analysis, providing global internet traffic insights
- Cloudflare Radar Bot & Crawler Insights -- Real-time bot traffic monitoring and crawler analysis
- Google DOJ Antitrust Trial Documents -- Court filings revealing Google's search distribution agreements
About the Author: I'm James Bennett, Lead Engineer at WebSearchAPI.ai, where I architect the core retrieval engine enabling LLMs and AI agents to access real-time, structured web data with over 99.9% uptime and sub-second query latency. With a background in distributed systems and search technologies, I've reduced AI hallucination rates by 45% through advanced ranking and content extraction pipelines for RAG systems. My expertise includes AI infrastructure, search technologies, large-scale data integration, and API architecture for real-time AI applications.
Credentials: B.Sc. Computer Science (University of Cambridge), M.Sc. Artificial Intelligence Systems (Imperial College London), Google Cloud Certified Professional Cloud Architect, AWS Certified Solutions Architect, Microsoft Azure AI Engineer, Certified Kubernetes Administrator, TensorFlow Developer Certificate.