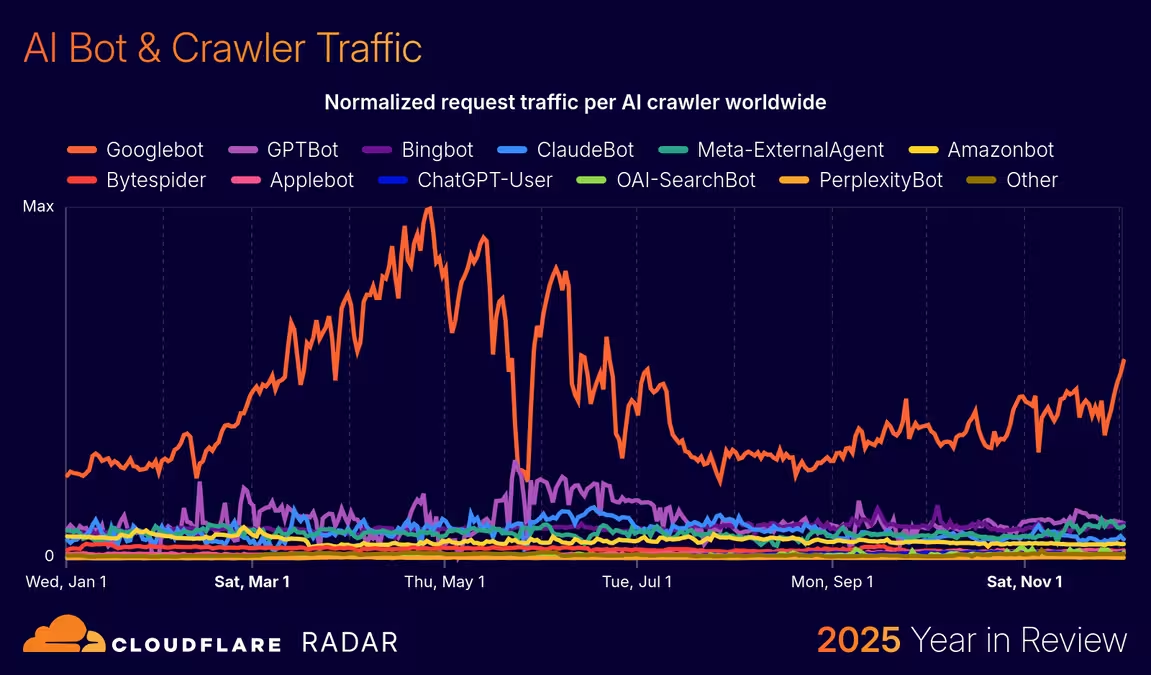
This report is updated monthly with fresh Cloudflare Radar data. Bookmark this page to track how AI crawlers are reshaping web traffic each month.
Last month I closed this report with a warning about its own headline: ClaudeBot had just posted the largest one-month gain any crawler has ever recorded here (+8.0 pp to 20.0%), and I forecast that "a +8 pp month is exactly the kind of spike that tends to retrace," with a base case that ClaudeBot would hold #2 while giving back share. That is precisely what happened. ClaudeBot fell -22% to 15.6% — the largest one-month decline in this report's history, mirroring its own record gain — and it held #2. The reversal rule has now claimed four crawlers in five months.
The counter-story is the crawler nobody expected to come back. Meta-ExternalAgent rebounded +27% to 12.9%, ending a three-month slide and retaking #3. Meanwhile Bytespider kept falling (7.3% → 4.7%, now #8), Googlebot's decline nearly stalled (24.9% → 24.6%), and the two most durable trends in this dataset both extended: Search crawling set another record at 11.8%, and the long tail of smaller crawlers grew faster than any named bot.
I analyzed the 28-day window covering July 6 through August 3, 2026 and compared it against the immediately preceding 28-day window (June 8 through July 6) — which is the exact window last month's edition reported on, so the "June 2026" column below reproduces last edition's published figures rather than a shifted approximation. The structural read: July was a month of mean reversion at the top and genuine diversification underneath. Top-five concentration resumed its slide to 71.9%, and the "other" bucket — every crawler outside the named top nine — grew +35% to 7.0%, its largest share of the year. New this edition, the robots.txt section is finally measured against a real denominator (Radar exposes how many robots.txt files it parsed), which settles a question last month's edition could only flag as a caveat. There's also concrete E-E-A-T guidance for site owners who want AI systems to cite them. If you want the foundational primer on the pipelines behind all this, our explainer on how search engines really work walks through crawl budgets, inverted indexes, and learning-to-rank — all the systems these bots are feeding.
📊 Stats Alert: ClaudeBot's record surge reversed, falling -22% (20.0% → 15.6%) — the largest one-month decline on record — though it held #2. Meta-ExternalAgent rebounded +27% to 12.9%, ending a three-month decline. Bytespider kept sliding to 4.7% (#8), and Googlebot's fall nearly stalled at 24.6%. Search crawling hit a new record 11.8% while Training dropped to 43.8% and Mixed Purpose rose for the first time in seven months. Mistral now sends effectively zero referrals, displacing Anthropic as the most extractive operator. On Workers AI, Z.ai's GLM-4.7-Flash debuted as the top text-generation model as Gemma 4 collapsed -71%.
Who Are the Top AI Crawlers in July 2026?
Googlebot remains the largest AI-related crawler globally, and this month its long decline finally decelerated — from 24.9% to 24.6%, a -0.3 pp move after six months averaging roughly -2 pp. Behind it, the top of the table partially un-did last month's reshuffle: ClaudeBot fell from 20.0% to 15.6%, giving back a little over half of June's record surge while holding #2. Meta-ExternalAgent rebounded to 12.9% (#3), its first gain in four months. GPTBot edged up to 9.8% (#4) and Bingbot rose to 9.0% (#5) — both essentially by standing still while ClaudeBot retreated around them.
Two crawlers moved on their own merits. Applebot climbed to 6.7% (#6) and Amazonbot to 6.1% (#7), while Bytespider extended its slide to 4.7% (#8) — down from 10.1% at its May peak, a two-month unwind that has now given back the entire spring ramp. In the search tier, Claude-SearchBot rose to 3.6% (+0.3 pp), quietly extending its lead as the single largest dedicated AI search crawler on the web (Claude web search) — the one Anthropic metric that kept climbing while its training crawler retreated.
| AI Bot | July 2026 Share (%) | June 2026 Share (%) | Operator | Primary Purpose |
|---|---|---|---|---|
| Googlebot | 24.6% | 24.9% | Search indexing + AI training (mixed) | |
| ClaudeBot | 15.6% | 20.0% | Anthropic | Model training |
| Meta-ExternalAgent | 12.9% | 10.2% | Meta | AI training |
| GPTBot | 9.8% | 9.6% | OpenAI | Model training |
| Bingbot | 9.0% | 8.1% | Microsoft | Search indexing + AI (mixed) |
| Applebot | 6.7% | 5.8% | Apple | Search + AI features |
| Amazonbot | 6.1% | 5.5% | Amazon | AI training |
| Bytespider | 4.7% | 7.3% | ByteDance | AI training |
| Claude-SearchBot | 3.6% | 3.3% | Anthropic | Claude web search |
| All other crawlers | 7.0% | 5.2% | Various | Mixed |
Last month's concentration spike was, as suspected, largely a one-month artifact of a single operator's surge. Top-five company concentration — Google, Meta, OpenAI, Anthropic, and Microsoft, counting each company's primary crawler — fell back to 71.9% in July from 72.8% in June, resuming the long decline from 84.5% in January (though it has not yet returned to May's 69.6% low). Anthropic's combined footprint (ClaudeBot 15.6% + Claude-SearchBot 3.6%) eased to 19.2% of all identified AI crawler traffic, still comfortably the #2 operator behind Google but no longer closing the gap.
The more interesting number is the one at the bottom of the table. Every crawler outside the named top nine grew from 5.2% to 7.0% (+35% relative) — the largest share the long tail has held all year, and the fastest-growing line in the entire dataset. When the biggest crawler in the world is flat and the fastest-growing segment is "everyone else," the diversification story is no longer about which giant is winning; it's about how many operators now run crawlers at meaningful scale.
If you're managing AI bot access on your site, the operator that most needs a fresh look this month is Meta — its crawler reversed direction after three months of decline, and a robots.txt tuned to "Meta is fading" is now out of date. For context on how crawling translates into actual referral traffic back to websites, check our companion Search Engine Referral Report on crawl-to-refer ratios — and see the crawl-to-refer breakdown further down this report.
Which AI Crawlers Gained or Lost Ground This Month?
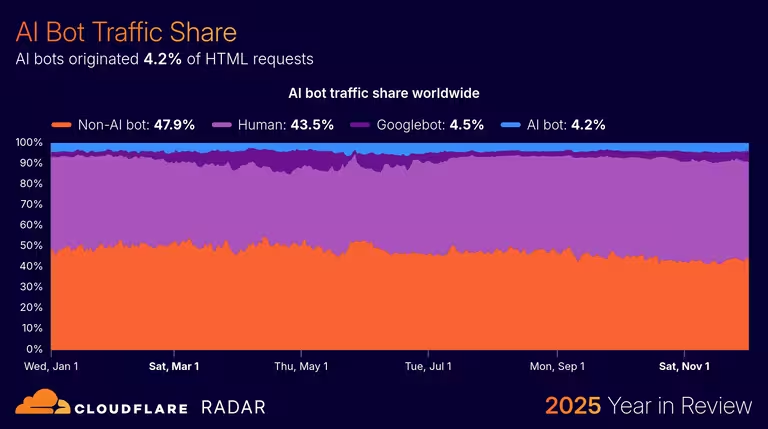
July inverts June's shape. Last month a single crawler's surge absorbed declines across the board; this month a single crawler's retreat redistributed share to almost everyone else. ClaudeBot's -4.4 pp was spread across Meta-ExternalAgent (+2.7 pp), the long tail (+1.8 pp), Bingbot (+0.9 pp), Applebot (+0.8 pp), Amazonbot (+0.6 pp), Claude-SearchBot (+0.3 pp), and GPTBot (+0.2 pp). Only Bytespider (-2.6 pp) and Googlebot (-0.3 pp) fell alongside it.
| AI Bot | June 2026 Share | July 2026 Share | Change (pp) | Relative Change |
|---|---|---|---|---|
| Googlebot | 24.9% | 24.6% | -0.3 | -1.1% |
| ClaudeBot | 20.0% | 15.6% | -4.4 | -22.2% |
| Meta-ExternalAgent | 10.2% | 12.9% | +2.7 | +26.9% |
| GPTBot | 9.6% | 9.8% | +0.2 | +1.9% |
| Bingbot | 8.1% | 9.0% | +0.9 | +11.0% |
| Applebot | 5.8% | 6.7% | +0.8 | +14.0% |
| Amazonbot | 5.5% | 6.1% | +0.6 | +10.0% |
| Bytespider | 7.3% | 4.7% | -2.6 | -35.1% |
| Claude-SearchBot | 3.3% | 3.6% | +0.3 | +8.5% |
| All other crawlers | 5.2% | 7.0% | +1.8 | +34.8% |
Six trends stand out from this comparison:
-
ClaudeBot's record surge reversed — and I called it. Anthropic's training crawler fell from 20.0% to 15.6% (-4.4 pp, -22% relative), the largest one-month decline in this report's history, immediately after posting the largest one-month gain. In last month's forecast I wrote that "a +8 pp month is exactly the kind of spike that tends to retrace," with a base case that ClaudeBot would hold #2 while giving back share. It gave back 55% of the surge and held #2. That is the reversal rule working as designed — but note what it does not say: ClaudeBot at 15.6% is still well above the 12.1% it started June at. The spike reverted; the underlying trend did not.
-
Meta-ExternalAgent rebounded — the first genuine surprise in months. Meta's crawler gained +2.7 pp to 12.9%, its first increase in four months, retaking #3. I had written Meta off twice: first predicting a "plateau at 18-20%" (wrong), then concluding its Q1 campaign was "a finite campaign, not a new baseline" (also now looking premature). A crawler that declines for three months and then adds 27% in one is not running a finished campaign. The honest read is that Meta's crawling is episodic — it ramps for training runs and idles between them — which makes it the hardest major crawler to forecast and the one most likely to surprise your logs.
-
Bytespider's unwind completed. Down another -2.6 pp to 4.7%, ByteDance's crawler has now given back its entire spring ramp (3.6% in March → 10.1% in May → 4.7% in July). Two consecutive months of decline confirm what one month only suggested: May's spike was a finite training burst. Bytespider is the cleanest full example of the spike-and-revert cycle this report has documented end to end.
-
Googlebot's decline nearly stalled. After six months averaging roughly -2 pp, Googlebot slipped just -0.3 pp to 24.6%. This is the first month the most reliable trend in the dataset has meaningfully paused. It's too early to call a floor — one flat month is exactly the weak evidence this report keeps warning against — but a -0.3 pp month makes my "below 24% by end of Q3" call materially harder, and I'll score it honestly in September.
-
The search tier keeps building, still led by Anthropic. Claude-SearchBot rose +0.3 pp to 3.6%, extending its lead as the largest dedicated AI search crawler and growing while its sibling training crawler shrank — evidence that Anthropic's search and training pipelines scale independently. It has not yet cleared the 4% I forecast for Q3, but it has now risen every single month this year. If you're building apps that rely on real-time retrieval, understanding what a web search API is and how these bots work under the hood matters more than ever.
-
The long tail was the fastest-growing segment on the board. Crawlers outside the named top nine grew +1.8 pp to 7.0% (+35% relative) — a bigger relative gain than any individual crawler, including Meta's rebound. This is the diversification trend that has run all year, and it is now large enough that "other" would rank #6 if it were a single bot. For site owners, it means user-agent allowlists built around the famous names are covering a shrinking share of the crawling that actually hits your origin.
What Are AI Bots Actually Doing With the Content They Crawl?
July's crawl-purpose data has the same single driver as June's, running in reverse. Because ClaudeBot is a pure training crawler, its -4.4 pp retreat pulled Training down -3.5 pp to 43.8% — its lowest reading since January. Mixed Purpose rose +1.4 pp to 40.3%, reversing its recent direction as Googlebot flattened and Bingbot gained. And Search set another record, climbing +1.4 pp to 11.8%.
| Crawl Purpose | July 2026 Share | June 2026 Share | Change (pp) |
|---|---|---|---|
| Training | 43.8% | 47.3% | -3.5 |
| Mixed Purpose | 40.3% | 38.9% | +1.4 |
| Search | 11.8% | 10.5% | +1.4 |
| User Action | 2.7% | 2.5% | +0.2 |
| Undeclared | 1.3% | 0.8% | +0.5 |
Here's what the July data tells website owners:
Training fell to 43.8% — and the Q2 "training takeover" thesis needs revising. Training has now dropped -6.1 pp from its 49.9% Q1 peak, and this month's -3.5 pp is its steepest single-month fall. For most of this year I framed Training's rise as the structural story and Mixed Purpose's decline as its mirror. Two quarters of data now say something more specific: Training's level is driven by whichever lab is mid-training-run, which makes it the most volatile series in this dataset, not the most structural one. It is still the plurality — roughly 44 of every 100 AI bot requests — but treat its monthly level as a read on lab activity, not a trend line.
Mixed Purpose rose to 40.3%, its highest reading since May. Crawlers that simultaneously index for search and collect training data gained +1.4 pp, reversing the fall I reported last month. The cause is not a Googlebot recovery — Googlebot was roughly flat — but Bingbot's +0.9 pp gain plus Training's retreat mechanically lifting everything else. (I've dropped the "consecutive months of decline" framing I used in previous editions: Radar re-based this classification corpus mid-Q2, which makes streak counts across that boundary unreliable. Month-over-month deltas computed in a single call, like the ones in this table, remain sound.) You still can't separate the AI training from the search indexing with these crawlers — block Googlebot and you disappear from Google Search. For developers looking at how to ground AI responses with Google Search alternatives, this bundling problem keeps coming up.
Search crawling hit a new record at 11.8% — the one trend that never reverses. AI search crawlers rose +1.4 pp, matching Mixed Purpose for the largest gain of the month, led again by Claude-SearchBot (now 3.6%, the largest dedicated AI search crawler). This is worth stating plainly: Search has risen in every edition since March, and has never given back a gain the way the crawler tables do. Its only decline all year was a -0.5 pp dip in March (6.9% → 8.2% → 7.7%); from there it has climbed to 10.0%, 10.5%, and now 11.8%. While Training swung from 42.0% up to 49.9% and back to 43.8%, and individual crawlers spiked and collapsed, Search has simply ground upward. It is the closest thing to a genuine structural trend in this dataset, and it's the one most relevant to whether your content gets cited rather than just ingested. The growing ecosystem of AI search API alternatives is the developer-facing side of exactly this shift.
User Action ticked up to 2.7%. Real-time, user-triggered fetches (ChatGPT-User and equivalents) gained +0.2 pp to their highest reading of the year. This is the category most directly tied to AI assistants' "browse" features, and combined with Search it means 14.5% of AI crawling is now a bot fetching a page to answer a live question — up from 9.1% in January.
The structural story of July is that retrieval kept climbing while training receded. For the first time, the two moved in opposite directions on a scale that matters: Search + User Action gained +1.6 pp while Training lost -3.5 pp. Anthropic is the clearest illustration — its training crawler shrank 22% while its search crawler grew 8.5% in the same window, from the same operator, on the same infrastructure. Training volume follows training runs; retrieval volume follows user demand. Only one of those compounds.
Which Industries Are AI Bots Targeting Most?
The industry mix reversed again in July, and this time it took one of my own conclusions with it. Shopping & General Merchandise gave back its June rebound, falling from 27.2% to 25.2% (-2.0 pp) — an almost exact mirror of last month's +2.0 pp gain. Computer & Electronics rose +0.9 pp to 19.3% and Internet & Telecom edged up +0.4 pp to 20.7%. The retail-content pendulum has now swung in four consecutive months without settling.
| Industry Vertical | July 2026 Share | June 2026 Share | Change (pp) |
|---|---|---|---|
| Shopping & General Merchandise | 25.2% | 27.2% | -2.0 |
| Internet and Telecom | 20.7% | 20.3% | +0.4 |
| Computer and Electronics | 19.3% | 18.4% | +0.9 |
| News, Media, and Publications | 8.9% | 9.5% | -0.6 |
| Gambling | 6.7% | 6.6% | +0.1 |
| Business and Industry | 3.7% | 3.5% | +0.3 |
| Professional Services | 2.8% | 2.6% | +0.2 |
| Finance | 2.6% | 2.5% | +0.0 |
| Games | 2.3% | 2.2% | +0.1 |
⚠️ A correction I owe you. For three editions I described News, Media & Publications as "the steadiest riser" and "more informative than the month-to-month retail swings," on the strength of a three-month climb. In July it fell -0.6 pp to 8.9%, its first decline of the year and its lowest reading since April. Three months of movement in one direction was not enough evidence to call something structural — which is exactly the standard this report applies to crawlers and should have applied here. The retrieval logic behind the claim (real-time fetches favor fresh editorial content) may still be right; the vertical data simply doesn't demonstrate it yet. I'm demoting it from "trend" to "watch item" until it strings together a longer run.
Shopping remains comfortably the most-crawled vertical, but its lead over Internet & Telecom narrowed to 4.5 pp from nearly 7 pp. The genuinely steady line this quarter is Computer & Electronics, up in three of the last four months to 19.3% — a slower, less dramatic climb than the one I over-read in News/Media, and one I'll hold to the same standard before calling it a trend.
The industry-level breakdown gets more granular:
| Industry | July 2026 Share | June 2026 Share | Change (pp) |
|---|---|---|---|
| Retail | 22.6% | 24.7% | -2.1 |
| Computer Software | 17.5% | 16.8% | +0.7 |
| Gambling & Casinos | 6.1% | 6.1% | +0.0 |
| IT and Services | 6.0% | 6.1% | -0.1 |
| Marketing and Advertising | 5.3% | 5.2% | +0.1 |
| Media | 5.3% | 4.8% | +0.5 |
| Internet | 4.7% | 4.7% | +0.0 |
| Adult Entertainment | 4.2% | 5.0% | -0.7 |
| Telecommunications | 3.0% | 2.8% | +0.2 |
The most notable industry-level move is Retail falling -2.1 pp to 22.6%, mirroring the Shopping vertical's retreat, while Computer Software rose +0.7 pp to 17.5% and closed the gap to five points — AI crawlers are still targeting documentation, code, and developer content heavily, and this is the second-most-crawled industry in every edition this year. Media overtook Adult Entertainment (5.3% vs 4.2%), reversing last month's ordering — another swap that says more about which training crawler was mid-run than about durable demand. If you maintain developer documentation, API references, or technical tutorials, this is why choosing the right AI web search API for your applications matters — these crawlers are the infrastructure behind the search results your users see, and software content is the one industry ranking that has never moved.
AI training crawlers aren't the only bots scanning the web at this scale, either. Technology detection platforms like Technologychecker.io crawl and fingerprint over 50 million domains using HTTP header analysis, JavaScript fingerprinting, DNS lookups, and headless browser rendering to identify 40,000+ technologies. Unlike AI training crawlers that take content for model weights, technology intelligence crawlers need to re-crawl frequently to track stack changes and new tech adoptions.
How Much Traffic Do AI Crawlers Give Back?
Cloudflare Radar's crawl-to-refer ratio — the number of pages an operator crawls for every one referral it sends back to a website — is the single most honest measure of whether a given AI company is a fair exchange or a pure extractor. July produced the largest shake-up this metric has shown: Anthropic is no longer the most extractive operator on the list. It improved again, to roughly 1,683:1 from ~2,947:1, continuing a five-month climb down from ~43,000:1 in January. The operator that displaced it did so by a margin that broke the scale.
| Operator | July 2026 (crawls : 1 referral) | June 2026 | Direction |
|---|---|---|---|
| Mistral | ~33,580 : 1 ⚠️ | 308 : 1 | Effectively no referrals |
| Anthropic | 1,683 : 1 | 2,947 : 1 | Improving (5th month) |
| Perplexity | 322 : 1 | 218 : 1 | Worsening |
| OpenAI | 245 : 1 | 513 : 1 | Improving fast |
| Microsoft | 37 : 1 | 37 : 1 | Flat |
| Yandex | 28 : 1 | 25 : 1 | Slightly worse |
| Baidu | 12 : 1 | 11 : 1 | Slightly worse |
| ByteDance | 9 : 1 | 11 : 1 | Improving |
| 4.8 : 1 | 5.0 : 1 | Most generous | |
| DuckDuckGo | 2.3 : 1 | 2.3 : 1 | Near-even |
⚠️ Read the Mistral figure as a direction, not a number. The API returns 33580.0 for Mistral on this window — a suspiciously round value, because the denominator is essentially a single referral event. Re-querying shorter windows makes it explicit: on the trailing 7-, 14-, and 28-day ranges, Radar returns inf for Mistral — meaning zero referrals recorded against a substantial volume of crawling. So the honest statement is not "Mistral crawls 33,580 pages per referral"; it is "Mistral crawls at scale and refers approximately nothing." The precise ratio is unstable and will move wildly month to month; the qualitative finding is solid and corroborated by a separate endpoint in our companion Search Engine Referral Report, which flagged Mistral's blowout on an earlier window.
Beyond Mistral, three moves matter. Anthropic's ratio improved for the fifth straight month, to ~1,683:1 — and the mechanism is now unmistakable. This month its training crawler shrank 22% while its search crawler grew 8.5%; a smaller numerator and a larger denominator both push the ratio down. OpenAI improved fast, to 245:1 from 513:1, roughly halving for the second month running. And Perplexity worsened to 322:1, quietly overtaking OpenAI to become the second-most extractive named operator — an uncomfortable position for a product that markets itself on citing sources. Meanwhile Google returns the most traffic relative to what it takes, at 4.8:1 — the structural advantage of running search and AI crawling through bundled infrastructure that still drives clicks — and DuckDuckGo, which leans on others' indexes, is nearly even at 2.3:1.
For website owners, this is the number that reframes the "should I block AI crawlers?" question. A ~5:1 ratio (Google) is a recognizable search-engine bargain — you give crawl access, you get visitors. A ratio in the thousands is not a bargain in the traditional sense; it's content acquisition with very little traffic return. That gap is the clearest data-backed case for treating training crawlers and search crawlers differently in your robots.txt — exactly the separation Anthropic's own ClaudeBot/Claude-SearchBot split now makes possible. And note the pattern across the whole table: every operator whose ratio improved this month runs a growing search crawler; the operators getting worse (Mistral, Perplexity, Yandex, Baidu) are the ones crawling without a proportionate referral channel. That's a preview of the E-E-A-T argument below.
Source: Cloudflare Radar — radar/bots/crawlers/summary/crawl_refer_ratio (radar.cloudflare.com), July 6 – August 3, 2026 vs. June 8 – July 6, 2026. Normalization is RATIO, which can return unbounded or inf values when an operator's referral count approaches zero.
How Are Websites Fighting Back Against AI Crawlers?
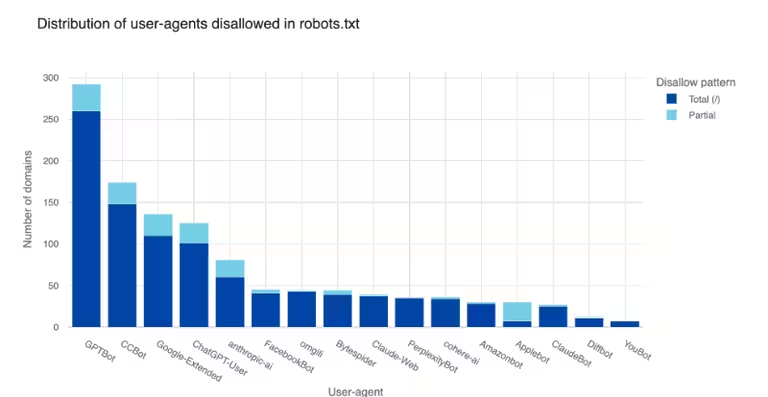
✅ Methodology upgrade — last month's caveat is now answered. In the June edition I reported raw domain counts and warned that because nearly every crawler's count rose at once, the increases "almost certainly reflect growth in Cloudflare's parsed robots.txt sample rather than a synchronized blocking wave," so readers should ignore the absolute deltas. That caution was right to make and is now testable: Radar's response exposes filesParsed, the number of robots.txt files behind each snapshot. The sample grew from 4,150 files on July 6 to 4,298 on August 10 — just +3.6%, while every single tracked crawler's references grew between +6.6% and +19.2%. The rises are real adoption, not a bigger sample. This edition therefore reports both the raw count and the share of parsed files, which is the honest normalized figure I couldn't compute last month.
Most Referenced AI Crawlers in robots.txt — July 2026
Snapshot dates: August 10, 2026 (4,298 files parsed) vs. July 6, 2026 (4,150 files parsed).
| AI Crawler | Domains (Jul) | Domains (Jun) | Change | Growth | Share of parsed files | Operator |
|---|---|---|---|---|---|---|
| GPTBot | 796 | 714 | +82 | +11.5% | 18.5% (from 17.2%) | OpenAI |
| ClaudeBot | 703 | 624 | +79 | +12.7% | 16.4% (from 15.0%) | Anthropic |
| Google-Extended | 671 | 595 | +76 | +12.8% | 15.6% (from 14.3%) | |
| CCBot | 640 | 577 | +63 | +10.9% | 14.9% (from 13.9%) | Common Crawl |
| Bytespider | 562 | 494 | +68 | +13.8% | 13.1% (from 11.9%) | ByteDance |
| meta-externalagent | 510 | 441 | +69 | +15.6% | 11.9% (from 10.6%) | Meta |
| Amazonbot | 491 | 419 | +72 | +17.2% | 11.4% (from 10.1%) | Amazon |
| Applebot-Extended | 486 | 410 | +76 | +18.5% | 11.3% (from 9.9%) | Apple |
| PerplexityBot | 453 | 423 | +30 | +7.1% | 10.5% (from 10.2%) | Perplexity |
| Googlebot | 422 | 394 | +28 | +7.1% | 9.8% (from 9.5%) | |
| ChatGPT-User | 415 | 371 | +44 | +11.9% | 9.7% (from 8.9%) | OpenAI |
| facebookexternalhit | 373 | 350 | +23 | +6.6% | 8.7% (from 8.4%) | Meta |
| OAI-SearchBot | 349 | 305 | +44 | +14.4% | 8.1% (from 7.3%) | OpenAI |
| bingbot | 304 | 255 | +49 | +19.2% | 7.1% (from 6.1%) | Microsoft |
Every crawler gained share of the parsed corpus this month. That is the single most important finding here, and it is a genuine shift in what this section can claim: robots.txt adoption is broadening across the board, not merely tracking a growing sample. Against a +3.6% sample, references grew roughly two to five times faster.
The fastest risers are the bots people have only recently started noticing. bingbot (+19.2%), Applebot-Extended (+18.5%), Amazonbot (+17.2%), and meta-externalagent (+15.6%) lead — none of them the famous names. Applebot-Extended climbed another rung to #8 even though Applebot's traffic rose only modestly, and Amazonbot passed PerplexityBot into #7. Adoption keeps following awareness on a lag: owners add directives for the crawler they noticed in last quarter's logs.
The slowest risers are, once again, the search-indexing bots. facebookexternalhit (+6.6%), PerplexityBot (+7.1%), and Googlebot (+7.1%) grew barely above half the field's pace. Last month these were the two entries that outright fell; this month they merely lag. The direction of the signal is unchanged even though its sign flipped — site owners are consistently less interested in restricting the bots that send visitors than the ones that don't. Note that PerplexityBot has now joined that group, which is interesting given its worsening crawl-to-refer ratio above: owners appear to still treat Perplexity as a referrer, even as the data says it refers less than it used to.
The traffic-vs-blocking gap narrowed for Anthropic and widened for Meta. ClaudeBot is #2 by references (16.4% of parsed files) and #2 by traffic (15.6%) — those now line up almost exactly, the tightest correspondence of any crawler. Meta-ExternalAgent, at 12.9% of traffic, sits #6 by references — and since Meta's traffic just rebounded +27% while its robots.txt growth was mid-pack, that gap is widening again. If you maintain a robots.txt, meta-externalagent is this month's most under-referenced high-traffic bot.
Two qualitative observations continue to hold:
- Selective adoption, not blanket blocks. Website owners add rules for specific crawlers as they notice them, not site-wide AI bans. The spread between the fastest riser (+19.2%) and slowest (+6.6%) is the fingerprint of crawler-by-crawler decisions rather than a uniform policy wave.
- The cohort is still a minority — but no longer a rounding error. The top-referenced crawler, GPTBot, now appears in 18.5% of the robots.txt files Radar parses, up from 17.2% a month ago. That is a real and accelerating minority within this sample. Two caveats keep it in perspective: Radar's parsed corpus is a sample of a few thousand files, not the global web, and a reference is not necessarily a block — naming a crawler can also mean explicitly allowing it.
What's Happening on Cloudflare Workers AI?
Beyond crawlers, Cloudflare Radar tracks usage patterns on Cloudflare Workers AI — the platform that lets developers run AI models at the edge. Last month this metric changed character entirely, pivoting from speech to embeddings, and I flagged that a single batch job can do that. The test of whether June's shift was a batch artifact or a real platform change was simple: does it survive a second month? It did. Text Embeddings held at 82.0% of all inferences (from 82.8%), and BAAI's multilingual BGE-M3 edged up to 77.0%. Workers AI is an embeddings platform, and that is now a two-month fact rather than a one-month spike.
⚠️ Read this metric with care. Unlike the crawler shares above, Workers AI figures are share of inference requests, so a handful of high-volume batch jobs (bulk embedding a corpus, transcribing an audio archive) can dominate the mix and swing it hard month to month. When one model holds three-quarters of all inferences, everything below it is competing for a very small remainder — a model moving from 4.4% to 1.3% may reflect one customer's workload ending, not a shift in developer preference. Treat the table below as a snapshot of what ran, not a durable popularity ranking of models.
Most-Used Models (by Share of Inferences)
| Model | July 2026 Share | June 2026 Share | Task | Developer |
|---|---|---|---|---|
| BGE-M3 | 77.0% | 75.3% | Text Embeddings | BAAI |
| Whisper Large V3 Turbo | 2.7% | 2.1% | Speech (ASR) | OpenAI |
| M2M-100 1.2B | 2.1% | 1.3% | Translation | Meta |
| BGE Base EN v1.5 | 2.1% | 3.7% | Text Embeddings | BAAI |
| GLM-4.7-Flash | 2.1% | — (tail) | Text Generation | Z.ai |
| Whisper | 1.7% | — (tail) | Speech (ASR) | OpenAI |
| BGE Small EN v1.5 | 1.5% | 2.0% | Text Embeddings | BAAI |
| Gemma 4 26B-A4B-IT | 1.3% | 4.4% | Text Generation | |
| Llama 4 Scout 17B | 1.2% | 1.2% | Text Generation | Meta |
The embeddings story consolidated rather than reversed. BGE-M3 gained another 1.6 pp to 77.0% of inferences, and three BAAI embedding models occupy the top tier. This matters precisely because it's the second month: by this report's own standard — a single steep month is a spike until it survives a second month — embeddings have now cleared the bar that Applebot, Bytespider, GPT-OSS 120B, and Kimi K2.6 all failed. The reversal rule cuts both ways, and this is the first time it has confirmed a trend rather than killed one.
The chat-model race produced its fourth leader in four months. Z.ai's GLM-4.7-Flash debuted straight into the top tier at 2.1%, making it the most-used text-generation model on Workers AI. It displaced Google's Gemma 4 26B, which collapsed -71% from 4.4% to 1.3% — and Gemma 4 was the model I named "the chat-model leader" only last month. Alibaba's Qwen3 30B, #6 in June, dropped out of the top nine entirely. Tally the sequence: Llama 3 8B → Kimi K2.6 → Gemma 4 → GLM-4.7-Flash, each crowned and dethroned within a month or two. In a metric where the leader holds 2% and the platform leader holds 77%, the "top chat model" is mostly a readout of whose batch job ran this month. I flagged Gemma 4 too confidently in June; I'm flagging GLM-4.7-Flash with the caveat attached.
Task Distribution
| Task Type | July 2026 Share | June 2026 Share | Change (pp) |
|---|---|---|---|
| Text Embeddings | 82.0% | 82.8% | -0.7 |
| Text Generation | 9.8% | 11.2% | -1.4 |
| Automatic Speech Recognition | 4.6% | 2.7% | +1.9 |
| Translation | 2.2% | 1.3% | +0.9 |
| Text-to-Image | 0.6% | 0.9% | -0.2 |
| Text Classification | 0.6% | 0.9% | -0.3 |
After June's violent reshuffle (+44 pp to embeddings, -47 pp from speech), July was remarkably stable — no category moved more than 2 pp. Text Embeddings held above 82%, Text Generation eased to 9.8%, and Automatic Speech Recognition recovered modestly to 4.6% as new transcription work arrived. Two consecutive stable months at ~82% embeddings is the strongest evidence yet that this is the platform's actual workload mix rather than one customer's project: the edge is increasingly used to power retrieval (embeddings feeding vector search and RAG) rather than one-off generation, which is the same shift the crawler data has shown all year. For a primer on why embeddings sit under modern AI search, our explainer on how to build AI search for a website walks through the retrieval pipeline these workloads feed.
What the July Data Means for E-E-A-T and AI Citability
July sharpened this argument in a way June only hinted at. Search crawling hit another record at 11.8%, and combined with User Action, 14.5% of all AI crawling is now a bot fetching a page to answer a live question — up from 9.1% in January. Meanwhile Training fell -3.5 pp. For the first time the two lines moved decisively in opposite directions, and the single clearest illustration is Anthropic: in the same window, on the same infrastructure, its training crawler shrank 22% while its search crawler grew 8.5%. The game is shifting from being scraped to being cited — and getting cited is precisely what Google's E-E-A-T framework (Experience, Expertise, Authoritativeness, Trustworthiness) was built to earn. The same signals that make a human editor trust a page are what make a retrieval crawler quote it.
Here's how each July signal maps to an E-E-A-T lever you can actually pull:
| E-E-A-T pillar | July signal driving it | What it rewards |
|---|---|---|
| Experience | Search + User Action at 14.5%; retrieval fetches specifics | First-hand data, screenshots, tests, lived detail an AI can quote |
| Expertise | Training fell to 43.8% — ingestion is no longer the growth path | Depth that earns a citation, not just inclusion in a corpus |
| Authoritativeness | Crawl-to-refer splits cleanly by whether an operator runs search | Being the primary source others cite; resolvable identity |
| Trustworthiness | Mistral refers ~nothing; Google refers at 4.8:1 | Verifiable claims, dated data, disclosed methodology and authorship |
Experience — the retrieval shift rewards first-hand specifics. Claude-SearchBot and its peers fetch pages to answer a specific question, then decide what to quote. Generic, paraphrased content loses that competition to pages carrying something only the author could produce: original measurements, screenshots, reproducible tests, real numbers. This very report is the pattern in miniature — it's citable because it runs original queries against the Cloudflare Radar API each month, and this edition is a concrete example of why that matters: pulling filesParsed from the raw API response is what let me replace last month's guess about robots.txt growth with a measured answer. If you want AI answers to pull from you, publish the thing that can't be paraphrased from elsewhere.
Expertise — the growth is in retrieval, so optimize to be quoted, not merely ingested. Training fell -3.5 pp this month, and its two-quarter pattern now looks episodic rather than structural — it rises when a lab is mid-run and falls when the run ends. You cannot build a content strategy around a lab's training calendar. Retrieval, by contrast, has risen in every edition since March, and retrieval crawlers make a selection decision your content can influence: they fetch several pages and quote the one that answers precisely, with terminology used correctly and a named author who demonstrably knows the field. Depth still compounds — but the payoff has moved from "included in the corpus" to "chosen as the citation."
Authoritativeness — the crawl-to-refer table is an authority ranking in disguise. Look at which operators improved this month (Anthropic, OpenAI, ByteDance, Google) versus which got worse (Mistral, Perplexity, Yandex, Baidu): every improver runs a growing search crawler. Referrals come from being cited in an answer, which means the crawl-to-refer ratio is, indirectly, a measure of how often that operator finds pages worth attributing. The lever is to become the source other pages cite, and to make your identity machine-resolvable. Clear Organization, Author, and Article structured data lets a crawler connect a claim to a credible entity; our primer on how search engines really work covers why entity and link signals still anchor authority in an AI-retrieval world.
Trustworthiness — the crawl-to-refer gap is a trust ledger. The spread in this month's table is the widest it has ever been: Google returns a visitor for every 4.8 pages it crawls, while Mistral crawls at scale and returns effectively nothing. A search crawler will only surface a page it can quote confidently. Make that easy: cite primary sources, date every statistic, show your methodology (this report names its exact API endpoints, its 28-day windows, and — as in the News/Media correction above — the calls it got wrong), and disclose who wrote it. Those are the signals that let a retrieval system attach your claim to a citation instead of dropping it. For developers building on the other side of this — grounding AI answers in verifiable sources — what a web search API is walks through the retrieval layer that makes citation possible.
💡 Expert Insight: This month gave the reversal rule its most useful test yet, and the result cuts both ways. ClaudeBot's record surge reverted, as predicted — but Workers AI embeddings held at 82% for a second month and were thereby confirmed, and Search crawling extended a run that now spans five months. The rule was never "everything reverts"; it's "one month is not evidence." Applied to E-E-A-T, that's the whole argument against spiky tactics: a tactic that produces one good month is indistinguishable from noise, while first-hand experience, demonstrated expertise, earned references, and verifiable trust signals are exactly the kind of thing that survives the second-month test.
The through-line: as crawling tilts from training toward retrieval, the content that wins is the content an AI can stand behind when it cites you. Every action in the website-owner checklist below — separating search from training crawlers, allowing Claude-SearchBot, keeping content fresh — is downstream of one idea: make your pages the ones AI systems trust enough to quote.
Q1 2026 Quarterly Review: The Great Reshuffling
Q1 2026 was the most transformative quarter in the history of AI web crawling. This section compiles data from three consecutive monthly analyses to document the structural shifts reshaping how AI companies interact with the open web.
Q1 2026 at a Glance
| Metric | January 2026 | February 2026 | March 2026 | Q1 Change |
|---|---|---|---|---|
| Top crawler (Googlebot) | 38.7% | 34.6% | 31.6% | -7.1 pp |
| #2 crawler | GPTBot (12.8%) | Meta-ExternalAgent (15.6%) | Meta-ExternalAgent (16.7%) | Meta took #2 |
| Training crawl share | 42.0% | 45.4% | 49.9% | +7.9 pp |
| Mixed Purpose crawl share | 48.3% | 43.9% | 39.9% | -8.4 pp |
| Top 5 company concentration | 84.5% | 82.8% | 80.2% | -4.3 pp |
| Domains blocking GPTBot | 5.29% | 5.45% | 5.52% | +0.23 pp |
| Llama 3 8B (Workers AI) | 41.7% | 40.1% | 37.3% | -4.4 pp |
How Each Crawler Moved Across the Quarter
| AI Bot | Jan 2026 | Feb 2026 | Mar 2026 | Q1 Change (pp) | Q1 Direction |
|---|---|---|---|---|---|
| Googlebot | 38.7% | 34.6% | 31.6% | -7.1 | Declining |
| Meta-ExternalAgent | 11.6% | 15.6% | 16.7% | +5.1 | Rising |
| GPTBot | 12.8% | 12.1% | 12.0% | -0.8 | Stable/Slow decline |
| ClaudeBot | 11.4% | 11.1% | 11.7% | +0.3 | V-shaped recovery |
| Bingbot | 9.7% | 9.3% | 8.2% | -1.5 | Declining |
| Applebot | 2.5% | 3.1% | 5.8% | +3.3 | Surging |
| Amazonbot | 4.8% | 5.4% | 4.4% | -0.4 | Volatile |
| Bytespider | 3.5% | 3.3% | 3.6% | +0.1 | Flat |
| OAI-SearchBot | 2.0% | 2.6% | 2.2% | +0.2 | Volatile |
Googlebot's sustained decline is the defining trend of Q1. Losing 7.1 pp over three months represents the largest quarterly share loss for any single crawler in Cloudflare Radar's tracking history. This doesn't necessarily mean Google is crawling less — it means competitors are crawling more, faster. At 31.6%, Googlebot is no longer 2x the size of the next-largest crawler; the ratio to Meta-ExternalAgent is now 1.9x and shrinking.
Meta-ExternalAgent was the biggest winner of Q1. Gaining +5.1 pp over three months, Meta's crawler overtook GPTBot in February and never looked back. The growth rate decelerated across the quarter (+3.1 pp → +3.7 pp → +2.3 pp), suggesting Meta may be approaching a near-term equilibrium.
Applebot's March surge was the quarter's biggest surprise. After modest growth in January (+0.2 pp) and February (+0.6 pp), Applebot exploded in March (+3.2 pp, +124% relative). Over Q1, Applebot more than doubled from 2.5% to 5.8%. Apple is now a top-six AI crawler operator — a status no one predicted at the start of the quarter.
The Training-Mixed Purpose Crossover
The most consequential structural shift of Q1 2026 happened in the crawl purpose data:
| Crawl Purpose | Jan 2026 | Feb 2026 | Mar 2026 | Q1 Change (pp) |
|---|---|---|---|---|
| Training | 42.0% | 45.4% | 49.9% | +7.9 |
| Mixed Purpose | 48.3% | 43.9% | 39.9% | -8.4 |
| Search | 6.9% | 8.2% | 7.7% | +0.8 |
| User Action | 2.2% | 2.0% | 2.1% | -0.1 |
| Undeclared | 0.5% | 0.4% | 0.4% | -0.1 |
In January, Mixed Purpose led Training by 6.3 pp (48.3% vs 42.0%). By February, Training had overtaken Mixed Purpose for the first time (45.4% vs 43.9%). By March, the gap had widened to 10 pp (49.9% vs 39.9%).
This crossover represents a fundamental change in how AI companies interact with the web:
- Before Q1 2026: The majority of AI bot traffic came from dual-purpose crawlers (Googlebot, Bingbot) that bundled search indexing with AI training. Website owners couldn't separate the two.
- After Q1 2026: The majority comes from purpose-built training crawlers (GPTBot, ClaudeBot, Meta-ExternalAgent, Applebot) that exist solely to collect AI training data. Website owners can block these selectively.
The shift gives website owners more control. You can now block the majority of AI training crawling without sacrificing search visibility — something that wasn't possible when Mixed Purpose crawlers dominated.
Market Concentration Is Declining
| Metric | January | February | March |
|---|---|---|---|
| Top 5 companies (Google, Meta, OpenAI, Anthropic, Microsoft) | 84.5% | 82.8% | 80.2% |
| Top 6 companies (+ Apple) | 87.0% | 85.9% | 86.0% |
| Top 4 crawlers share | 74.4% | 73.5% | 72.0% |
The AI crawler market is diversifying. The traditional top five lost 4.3 pp of concentration over Q1, but when you include Apple as a sixth major player, the top-six concentration remained remarkably stable at ~86%. The diversification is happening within the top tier, not from outside it.
Quarterly Robots.txt Blocking Trends
| AI Crawler | Jan 2026 | Feb 2026 | Mar 2026 | Q1 Change |
|---|---|---|---|---|
| GPTBot | 5.29% | 5.45% | 5.52% | +0.23 pp |
| CCBot | 4.40% | 4.63% | 4.53% | +0.13 pp |
| ClaudeBot | 4.33% | 4.62% | 4.72% | +0.39 pp |
| Google-Extended | 4.04% | 4.36% | 4.37% | +0.33 pp |
| Googlebot | 4.13% | 3.77% | 3.80% | -0.33 pp |
| Bytespider | 3.69% | 3.73% | 3.67% | -0.02 pp |
| meta-externalagent | 3.24% | 3.26% | 3.34% | +0.10 pp |
| Amazonbot | 2.99% | 3.16% | 3.29% | +0.30 pp |
ClaudeBot saw the largest blocking increase across Q1 at +0.39 pp, overtaking CCBot to become the second-most referenced AI crawler in robots.txt files behind GPTBot. The blocking wave is real but slow — over the entire quarter, GPTBot grew from 5.29% to just 5.52%. More than 94% of domains still allow all AI crawlers unrestricted access. At the current rate, it would take years for blocking rates to reach even 10%.
The Traffic-Blocking Gap
| AI Crawler | March Traffic Share | March Blocking Rate | Gap (pp) |
|---|---|---|---|
| Googlebot | 31.6% | 3.80% | 27.8 |
| Meta-ExternalAgent | 16.7% | 3.34% | 13.4 |
| GPTBot | 12.0% | 5.52% | 6.5 |
| ClaudeBot | 11.7% | 4.72% | 7.0 |
| Amazonbot | 4.4% | 3.29% | 1.1 |
Meta-ExternalAgent's 13.4 pp gap is the most actionable — it's a dedicated training crawler with no search indexing benefit, yet it's blocked by fewer domains than GPTBot despite generating more traffic.
Workers AI Model Ecosystem Evolution
| Model | Jan 2026 | Feb 2026 | Mar 2026 | Q1 Change |
|---|---|---|---|---|
| Llama 3 8B Instruct | 41.7% | 40.1% | 37.3% | -4.4 pp |
| Stable Diffusion XL Base 1.0 | 13.4% | 13.4% | 12.3% | -1.1 pp |
| Whisper | 8.5% | 8.3% | 7.5% | -1.0 pp |
| Llama 4 Scout 17B | 7.7% | 6.7% | 7.0% | -0.7 pp |
| M2M-100 1.2B | 5.6% | 5.4% | 5.1% | -0.5 pp |
| Llama 3 8B Instruct (AWQ) | 4.7% | 4.9% | 4.4% | -0.3 pp |
| FLUX.1 Schnell | 2.4% | 2.5% | 3.0% | +0.6 pp |
| GPT-OSS 120B | -- | 1.6% | 2.1% | New (+2.1 pp) |
| Whisper Large V3 Turbo | 1.4% | 1.6% | 1.7% | +0.3 pp |
Every top model except FLUX.1 Schnell, GPT-OSS 120B, and Whisper Large V3 Turbo lost share across Q1. Meta's dominance is slowly eroding — from ~60% in January to 53.8% in March. GPT-OSS 120B is the breakout model of Q1, debuting in February and climbing to 2.1% in March. FLUX.1 Schnell is gaining on Stable Diffusion XL, emerging as a credible challenger in the text-to-image space.
Five Structural Shifts That Defined Q1 2026
-
The Training Takeover. Training crawlers went from minority (42.0%) to near-majority (49.9%) in a single quarter. The web's content is now primarily being consumed for AI model weights rather than search indexing. Website owners who want to opt out of AI training have clearer tools to do so.
-
The Google Erosion. Googlebot lost 7.1 pp across Q1. This is almost certainly driven by competitors growing faster rather than Google crawling less, but the proportional shift matters for every website owner's traffic analysis.
-
The Meta Ascendancy. Meta-ExternalAgent gained +5.1 pp, overtook GPTBot for #2 in February, and finished the quarter at 16.7%. Meta's aggressive Llama training pipeline is driving unprecedented data collection.
-
Apple's Arrival. Applebot went from 2.5% to 5.8% across Q1, with most growth concentrated in March. Apple is now a top-six AI crawler operator and should be included in any website owner's AI bot management strategy.
-
The Diversification of Workers AI. The model ecosystem became meaningfully more diverse. Llama 3 8B's share fell from 41.7% to 37.3% as developers adopted newer models and the long tail grew from ~15% to ~20%.
Q2 2026 Predictions (Made in the April Edition)
Based on Q1 trends, here's what I forecast for Q2 2026 — scored against end-of-Q2 data in the tracker below:
-
Training crawlers will exceed 55%. The +7.9 pp Q1 trajectory suggests Training could reach 55-57% by June 2026, with Mixed Purpose falling below 35%.
-
Googlebot will drop below 30%. The current quarterly decline rate would put Googlebot in the 28-30% range by end of Q2.
-
Applebot will enter the top five. If Apple sustains even half of March's growth rate, Applebot could pass Bingbot (currently 8.2%) by May or June.
-
Meta-ExternalAgent will plateau around 18-20%. The deceleration trend suggests Meta's growth rate is stabilizing.
-
GPT-OSS 120B will enter the Workers AI top five. At its current growth rate, it could reach 3-4% by June, approaching FLUX.1 Schnell territory.
-
Robots.txt blocking will remain below 6% for all crawlers. The slow growth rate means meaningful blocking thresholds remain years away.
Q3 Predictions Tracker: July Check-In
Q3 is one month old, so these are interim scores on the four calls I made in the June edition — with the caveat that a quarter-length forecast checked at the one-third mark is a progress report, not a verdict.
| # | Q3 call (made in June edition) | July 2026 Actual | Interim verdict |
|---|---|---|---|
| 1 | ClaudeBot's surge decelerates; base case is it holds #2 while giving back share | Fell -4.4 pp to 15.6%, held #2 | ✅ Hit |
| 2 | Googlebot will fall below 24% | 24.6% — decline slowed to -0.3 pp, its flattest month | ⏳ At risk |
| 3 | Search holds above 10% and Claude-SearchBot passes 4% | Search 11.8% (record) ✅; Claude-SearchBot 3.6% ⏳ | ⚠️ Half hit |
| 4 | Anthropic holds its rank by combined crawl share | 19.2% (15.6% + 3.6%), still #2 behind Google | ✅ Hit * |
* A correction to my own wording. June's prediction #4 said Anthropic would "remain the #1 operator by combined crawl share." That was wrong the day I wrote it — the same edition's body text correctly put Anthropic "second only to Google" at 23.3%. Anthropic was #2 then and is #2 now, so the rank held; the label in the prediction was simply an error, and I'd rather flag it than quietly restate the claim.
Prediction #1 is the one worth dwelling on, because it's the first time this report has forecast a specific reversal with a specific floor and had both halves land. The reversal rule is no longer just a retrospective pattern — it made a falsifiable call and survived it. Prediction #2 is the one now in trouble. Googlebot's decline has been the most reliable trend in this dataset for six months, and I extrapolated it straight; a -0.3 pp month is exactly the kind of evidence that should make me less confident, not more patient. Two more months at this rate leaves Googlebot near 24%, not below it.
Q2 2026 Final Scorecard (Historical Record)
The completed end-of-Q2 scorecard, kept here as the running record. The through-line of that quarter: structural trends compounded; momentum spikes reversed. Every prediction grounded in a multi-month trend hit; every prediction extrapolating a single steep month missed.
The six original April predictions, scored against June:
| # | Q2 Prediction (made in April) | Window | June 2026 Actual | Verdict |
|---|---|---|---|---|
| 1 | Training crawlers will exceed 55% | By June 2026 | 47.4% (corpus re-based; never neared 55%) | ❌ Miss |
| 2 | Googlebot will drop below 30% | End of Q2 | 24.9% — below 25%, still falling | ✅ Hit (overshot) |
| 3 | Applebot will enter the top five | May or June | Hit in April, reversed; #7 at 5.8% in June | ⚠️ Hit, then reversed |
| 4 | Meta-ExternalAgent will plateau at 18-20% | Q2 | Fell to 10.2% (third straight decline) | ❌ Miss |
| 5 | GPT-OSS 120B will enter Workers AI top five | By June | Spiked in April, gone from the top tier by June | ⚠️ Hit, then reversed |
| 6 | Robots.txt blocking will remain below 6% | Q2 | Top crawler in 712 of thousands of domains | ✅ Holds |
And the four revised calls I made last month for June:
| # | June call (made in May edition) | June 2026 Actual | Verdict |
|---|---|---|---|
| A | Bytespider will challenge GPTBot for #3 | Bytespider reversed to 7.3% (#6); didn't | ❌ Miss |
| B | Kimi K2.6 will challenge Llama 3 8B for #1 | Kimi fell out of the top 9; metric went to embeddings | ❌ Miss |
| C | Search crawl purpose will pass 10% | Reached a record 10.5% | ✅ Hit |
| D | Training will stay flat (not reach 55%) | Did not reach 55% (47.4%); climbed modestly | ✅ Hit |
The two calls that reversed both bet on momentum. I predicted Bytespider would keep climbing to challenge GPTBot (A) and Kimi K2.6 would keep climbing toward #1 (B). Both had posted steep one-month gains; both gave those gains back. That's now four momentum-based reversals across that quarter — Applebot, GPT-OSS 120B, Bytespider, Kimi K2.6 — spanning three different datasets, with ClaudeBot and Gemma 4 joining the list in July. If there's one durable rule this report has earned, it's this: a single steep month is a spike until it survives a second month.
The structural calls all hit. Googlebot's sub-30% prediction (#2) overshot to 24.9%. Search clearing 10% (C) landed on schedule. Training not reaching 55% (D) held. Each was grounded in a trend that had already run for months, not a one-month jump.
Revised Forecasts for the Rest of Q3 (August–September)
- Meta-ExternalAgent's rebound will not extend. By the rule above, +27% in one month is a spike until a second month confirms it — and Meta has now shown one finite campaign already this year. Base case: it holds #3 without adding materially. If it does gain again in August, that's the signal Meta has restarted a training run, and it becomes the crawler to prioritize.
- Googlebot will not fall below 24% by the end of Q3. I'm reversing my own June call. One flat month is weak evidence, but the honest response to weak evidence against a forecast is to widen the range, not to wait for it to be proven wrong. Revised base case: 24.0–24.6% at the end of September.
- Search crawl purpose will pass 12% and Claude-SearchBot will pass 4%. This is the one call I'd make with real confidence — Search has risen in every edition since March, and Claude-SearchBot has risen every month this year.
- The "other" bucket will pass 8%. Long-tail crawlers grew +35% this month to 7.0%. Diversification is the most under-covered trend in this dataset, and it does not depend on any single operator's training calendar.
- GPTBot will pass 20% of parsed robots.txt files. It sits at 18.5% and gained 1.3 pp between the two snapshots I can normalize. This is a two-point extrapolation — exactly the kind of thin evidence this report warns about — so treat it as the weakest call on the list. It's here because robots.txt adoption is the one series with an obvious ratchet: directives are rarely removed once added.
- Workers AI embeddings will hold above 75%. Two stable months at ~82% already cleared this report's second-month test. A third would move it from "current workload mix" to a settled platform characteristic.
What Should Website Owners Do About July's Trends?
Based on what I've found in the July 2026 Cloudflare Radar data, here are the actions I'd prioritize:
Revisit Meta-ExternalAgent — it's back. Meta's crawler gained +27% to 12.9% after three months of decline, and it is now the most under-referenced high-traffic bot in robots.txt (#3 by traffic, #6 by references, with the gap widening). I twice described Meta's crawling as a finished campaign; July says it's episodic, not finished. If you deprioritized meta-externalagent during its slide, add an explicit directive back.
Don't chase ClaudeBot's retreat either way. ClaudeBot fell -22% to 15.6% — but it entered June at 12.1%, so the spike reverted while the underlying trend did not. At 15.6% it remains the #2 crawler on the web and one in six AI crawler requests. Keep the explicit ClaudeBot directive I recommended last month; nothing about this month argues for removing it. This is the practical form of the reversal rule: add directives on trend, not on spikes, and don't remove them on dips.
Separate training from search — the crawl-to-refer data proves why. Anthropic improved again to roughly 1,683:1 (vs. Google's 4.8:1), and the mechanism is now visible in a single month: its training crawler shrank while its search crawler grew. Claude-SearchBot (search, now 3.6% and the largest AI search crawler) is distinct from ClaudeBot (training, 15.6%). If you want Claude's search to surface and cite your content while opting out of bulk training, use separate directives — allow Claude-SearchBot, decide on ClaudeBot — and apply the same logic to OpenAI's GPTBot/OAI-SearchBot split.
Add Mistral to your review list. Mistral's crawler now refers effectively nothing — Radar returns inf (zero referrals) on every recent window while it continues crawling at scale. That is the most one-sided exchange in the dataset, worse than Anthropic at its January peak. Unlike the search crawlers, there is no citation upside to weigh against it, so if you rate-limit any operator on economics alone, this is the clearest case in the table.
Optimize for the retrieval shift, not just against training. Search crawling hit a record 11.8% and Search + User Action now account for 14.5% of AI crawling, while Training fell -3.5 pp. A robots.txt written purely to block bulk training scrapers is optimizing against the shrinking half of the market and missing the real-time fetches that drive AI-assistant citations back to your site. Decide deliberately whether you want to be in AI answers (allow search crawlers, and make your content easy to cite — see the E-E-A-T section) or out of training sets (block training crawlers). They're now genuinely separable.
Stop writing allowlists around the famous names. Crawlers outside the top nine grew +35% to 7.0% — collectively larger than Applebot, Amazonbot, or Bytespider individually, and the fastest-growing segment in the dataset. A user-agent allowlist built around GPTBot, ClaudeBot, and Googlebot now covers a shrinking share of what actually hits your origin. Prefer default-deny-with-exceptions, or verified-bot checks, over enumerating the bots you've heard of.
Audit your Googlebot assumptions — but note the decline paused. Googlebot slipped just -0.3 pp to 24.6%, its flattest month of the year, after falling from ~39% in January. Roughly one in four AI bot requests is still Googlebot. The long-run direction is down, but this month is a reminder not to model that decline as a straight line.
How WebSearchAPI.ai Fits Into the AI Crawler Ecosystem
Every AI crawler in this report exists because AI companies need fresh, structured web data to power their models and search products. At WebSearchAPI.ai, we sit on the other side of this equation — providing developers and AI agents with a clean, fast, and affordable way to access real-time web data without running their own crawlers.
Here's why this matters in the context of July's trends:
- The balance keeps tilting toward real-time retrieval. Search crawling hit a record 11.8% while Training fell to 43.8% — the first month the two moved decisively in opposite directions — and on Workers AI, embeddings (the engine of vector search and RAG) held above 82% of inferences for a second month. Both signals point the same way: the next phase of AI is real-time fetching and retrieval, not just bulk training. Instead of building and maintaining crawling infrastructure for either job, WebSearchAPI.ai gives you instant access to structured search results, content extraction, and real-time web intelligence through a single API call.
- The crawler landscape reshuffles every month. With ClaudeBot's record surge reversing, Meta rebounding after three months of decline, Bytespider unwinding entirely, and the long tail growing faster than any named bot, the complexity of managing web data access never settles. WebSearchAPI.ai handles the retrieval layer so you can focus on your application logic.
- Sub-second latency, 99.9% uptime, and structured responses mean your AI applications get the data they need without the infrastructure headaches that come with managing crawler fleets.
If the data in this report tells you anything, it's that the volume and complexity of AI web crawling is only accelerating — and the balance is now tilting toward real-time retrieval. WebSearchAPI.ai is purpose-built for developers who want to harness that web intelligence without becoming a crawling operation themselves. Learn more about what a web search API can do for your stack.
Frequently Asked Questions
What is an AI crawler?
An AI crawler (also called an AI bot or AI spider) is an automated program that visits websites to collect content for training artificial intelligence models or powering AI-powered search features. Unlike traditional search engine crawlers that index pages for search results, AI crawlers like GPTBot, ClaudeBot, and Meta-ExternalAgent specifically collect data to train large language models (LLMs). Some crawlers like Googlebot serve both purposes — indexing for search and collecting training data simultaneously. You can identify AI crawlers by their user-agent strings in your server logs or through tools like Cloudflare Radar.
How often is this AI crawler report updated?
This report is updated monthly with fresh data from Cloudflare Radar AI Insights. Each edition covers a rolling 28-day window and compares it against the immediately preceding 28-day window, so every month-over-month figure is computed on an identical basis. Quarterly editions add full-quarter trajectory analysis (the Q1 2026 review remains in this post as a historical anchor). Bookmark this page or check back at the beginning of each month for the latest analysis of AI crawler traffic patterns, market share shifts, and robots.txt directives.
Can I block AI crawlers from my website?
Yes. The primary method is adding disallow rules to your robots.txt file for specific AI crawler user agents. For example, adding User-agent: GPTBot followed by Disallow: / will request that OpenAI's crawler stop visiting your site. However, robots.txt is a voluntary protocol — crawlers are not technically required to obey it. As of July 2026, GPTBot and ClaudeBot remain the two most-referenced AI crawlers in robots.txt files, appearing in 796 and 703 of the 4,298 files in Cloudflare Radar's parsed sample — 18.5% and 16.4% respectively. Every tracked crawler gained share this month, growing two to five times faster than the sample itself, so adoption is genuinely broadening rather than merely tracking a bigger sample. Some CDN providers like Cloudflare also offer dashboard-level controls to block or rate-limit AI bots.
What is the difference between AI training crawlers and AI search crawlers?
AI training crawlers (like GPTBot, ClaudeBot, and Meta-ExternalAgent) collect web content to build and improve AI models. They typically scrape large volumes of content from many sites. AI search crawlers (like OAI-SearchBot and Claude-SearchBot) fetch specific pages in real time when a user performs a search query through an AI tool like ChatGPT or Claude. The key difference: training crawlers take your content to make the model smarter, while search crawlers fetch your content to answer a specific user question — and may drive traffic back to your site. As of July 2026, training crawling is still the plurality at 43.8% of all AI bot traffic, but it fell -3.5 pp this month as ClaudeBot retreated, while search crawling hit a new record 11.8% — led by Anthropic's Claude-SearchBot, the largest dedicated AI search crawler at 3.6%. Adding user-triggered fetches, 14.5% of AI crawling is now a bot reading a page to answer a live question.
Will blocking AI crawlers affect my SEO or search rankings?
Blocking dedicated AI training crawlers like GPTBot, ClaudeBot, Meta-ExternalAgent, Bytespider, or Applebot-Extended will not affect your rankings in Google, Bing, or other traditional search engines. These crawlers are separate from the search indexing bots. However, blocking Googlebot will remove your site from Google Search entirely since Google uses the same crawler for both search indexing and AI training. Google offers a middle ground with the Google-Extended user agent — blocking it opts you out of AI training while keeping your search presence intact, and it is the #3 most-referenced AI crawler in robots.txt as of July 2026 (15.6% of parsed files). Apple offers the same kind of separation with Applebot-Extended, which climbed to #8 and was one of the fastest-growing directives this month (+18.5%).
Why did ClaudeBot's surge reverse in July 2026?
After ClaudeBot exploded +66% in June to 20.0% — the largest single-month gain any crawler has posted in this report's history — it fell -22% to 15.6% in July, giving back roughly 55% of the surge while holding the #2 spot. The most likely explanation is that June's spike was a concentrated training run rather than a permanent step-change in crawl volume, the same pattern Applebot showed in April and Bytespider in May. Notably, ClaudeBot did not return to its pre-surge level: it entered June at 12.1% and exited July at 15.6%, so the underlying growth trend survived even though the spike didn't. This is the recurring lesson of this report — a single steep month is a spike until it survives a second month — and it's why the June edition forecast this exact reversal.
What changed with Anthropic's crawlers in July 2026?
Anthropic's two crawlers moved in opposite directions, which is the most instructive thing in this month's data. ClaudeBot (training) fell from 20.0% to 15.6%, while Claude-SearchBot (search) rose to 3.6%, extending its lead as the largest dedicated AI search crawler. Same operator, same window, same infrastructure — one pipeline contracted 22% while the other grew 8.5%. Between them, Anthropic accounts for 19.2% of all identified AI crawler traffic, still second only to Google. The practical consequence shows up in the crawl-to-refer data: Anthropic's ratio improved for a fifth straight month to roughly 1,683:1, because a smaller training numerator and a larger referring denominator both push it down. It gives website owners a clear reason to set separate directives for the two bots — allow the search crawler that may cite you (Claude's web search functionality), decide deliberately on the training crawler that won't.
How does Cloudflare track AI crawler traffic?
Cloudflare's global network spans 330+ cities in 125+ countries and processes over 81 million HTTP requests per second. Through its Radar platform, Cloudflare identifies and classifies AI bot traffic by analyzing user-agent strings, request patterns, and behavioral signatures across all sites on its network. The data in this report comes from Cloudflare Radar's AI Insights endpoints, which aggregate these signals into share-of-traffic percentages by bot, crawl purpose, industry, and region.
Which AI crawler is growing the fastest in 2026?
In July 2026, Meta-ExternalAgent posted the largest gain among named crawlers, +2.7 pp (+27%) (10.2% → 12.9%), ending a three-month decline and retaking #3. But the fastest-growing segment overall was not a single bot: crawlers outside the top nine grew +35% to 7.0%, the largest relative gain in the dataset. Looking across the full year, the most consistent riser is Claude-SearchBot, which has gained in every month of 2026 to reach 3.6% — the largest dedicated AI search crawler on the web. Last month's standout, ClaudeBot, reversed sharply (-4.4 pp to 15.6%).
What percentage of web traffic comes from AI bots?
The percentages in this report represent share of identified AI bot requests, not share of total web traffic. Cloudflare Radar tracks the proportion of AI-related crawler activity relative to other AI bots, providing a competitive landscape view. The actual percentage of total web traffic from AI bots varies by website, but industry estimates suggest AI crawlers now account for a meaningful and growing share of overall internet traffic, particularly for content-heavy sites in retail, technology, and media.
How can I monitor AI crawler activity on my own website?
Check your server access logs for known AI bot user-agent strings (GPTBot, ClaudeBot, meta-externalagent, Applebot, Bytespider, Amazonbot, etc.). Most web analytics platforms filter out bot traffic by default, so log-level analysis gives the most accurate picture. Cloudflare users can view AI bot activity directly in their dashboard. For a structured approach, consider using a web search API to understand how your content appears in AI-powered search results and ensure your most important pages are properly accessible.
Cloudflare Radar Data Source & Methodology
Understanding where this data comes from — and what it can and cannot tell you — is critical for interpreting the trends above. Here's a full breakdown of how Cloudflare Radar collects, classifies, and aggregates the AI crawler data used in this report.
Network Scale
| Metric | Value |
|---|---|
| Global presence | 330 cities in 125+ countries |
| HTTP requests | 81 million/second average, peaks >129 million/second |
| DNS queries | 67 million/second (authoritative + resolver) |
This scale is what makes Cloudflare Radar one of the most comprehensive sources of internet traffic data available. The data in this report comes from two primary sources:
- Cloudflare's global network — real-time traffic data from HTTP requests flowing through their infrastructure
- 1.1.1.1 public DNS resolver — aggregated and anonymized DNS query data
For routing data, Cloudflare also uses RIPE RIS data from RIPE NCC (BGP route collectors).
How AI Bots Are Identified
Cloudflare uses a layered detection system to identify and classify AI crawlers:
- User-agent string matching — the most basic method; identifies bots that transparently announce themselves (GPTBot, ClaudeBot, etc.)
- Verified Bot Directory — manual approval process requiring bots to maintain public robots.txt commitments, use dedicated/verifiable IPs, unique user-agents, and honor crawl-delay settings
- Machine learning — supervised ML system that assigns a Bot Score (1-99)
- Heuristics — tailored rulesets for AI bot classification
- Behavioral analysis — pattern recognition from request sequences
- AI Labyrinth honeypot — hidden links to AI-generated decoy pages; bots that follow them are identified with high confidence since human visitors never see these links
- ai.robots.txt list — used as the basis for which AI bots to track
💡 Expert Insight: The layered approach matters because not all AI crawlers identify themselves honestly. User-agent matching catches transparent bots like GPTBot and ClaudeBot. Behavioral analysis and honeypots catch crawlers that disguise themselves as regular browsers.
How Crawl Purpose Is Classified
Bots are categorized into these purpose buckets:
- Training: dedicated training crawlers (GPTBot, ClaudeBot, Meta-ExternalAgent)
- Search: AI search bots (OAI-SearchBot)
- User Action: bots fetching pages for real-time user queries (ChatGPT-User)
- Mixed Purpose: bots serving dual roles like search indexing + AI training (Googlebot, Bingbot)
- Undeclared: purpose not identifiable
Data Aggregation Methods
- 7-day trailing average used to smooth daily fluctuations
- IPv4 addresses aggregated into /20 prefixes for visualization
- HTML traffic is separately classified into human, AI bot, and non-AI bot categories
- Normalization: data expressed as percentage of total requests (not absolute counts)
- Methodologies remain unchanged year-over-year for valid comparisons
- API data available under CC BY-NC 4.0 license
Caveats & Limitations
⚠️ Warning: Keep these limitations in mind when interpreting the data in this report:
- Countries with insufficient data volume are excluded from trend reporting
- Some metrics are available only at worldwide level, not per-country
- Mobile device categorization relies on User-Agent headers (accuracy limitations)
- Speed test data excludes locations with fewer than 100 tests per week
- The "location" filter corresponds to the billing country of the Cloudflare customer whose site received the traffic, not where the crawler is physically located
- Cloudflare sees traffic only to sites behind its network, not the entire internet, so the data is representative but not exhaustive
Report Parameters
This edition uses data from Cloudflare Radar's AI Insights endpoint (/radar/ai/bots/summary/*), Workers AI inference endpoint (/radar/ai/inference/summary/*), web-crawler endpoints (/radar/bots/crawlers/summary/{vertical|industry|crawl_refer_ratio}), and robots.txt analysis endpoint (/radar/robots_txt/top/user_agents/directive). The July 2026 monthly data covers the 28-day window of July 6 through August 3, 2026, with every month-over-month comparison computed against the immediately preceding 28-day window (June 8 through July 6, 2026).
A methodology change worth stating explicitly. Previous editions used the API's relative dateRange=28d / 28dControl pair. This edition pins both windows with explicit dateStart/dateEnd parameters instead, for two reasons. First, a relative 28-day window queried in mid-August would have covered mid-July through mid-August — an "August-ish" window labelled July. Second, and more usefully, pinning the control window to June 8 – July 6 makes it the exact same window last month's edition reported on, so the "June 2026" column here reproduces last edition's published figures rather than a window shifted by several days. Readers can compare the two editions directly. Both columns are still computed in a single API call under one classification methodology, which was the point of the original 28d/28dControl approach.
I queried bot traffic breakdowns by user agent, crawl purpose, industry, and vertical; the crawl-to-refer ratio by operator; Workers AI model and task distribution; and domain-level robots.txt directives. All percentages represent share of identified AI bot requests (for crawling data) or share of inference requests (for Workers AI data), not share of total web traffic. The crawl-to-refer ratio is a RATIO (crawls per referral) and can return unbounded or inf values when referrals approach zero — see the Mistral caveat above. Robots.txt figures are raw domain counts from a snapshot, now reported alongside their share of meta.filesParsed.
Note on Revised Values
⚠️ Cloudflare Radar aggregates and may revise data after publication. Because this edition pins its control window to last edition's exact reporting window, the "June 2026" columns should — and largely do — match last month's published figures. The AI crawler share table reproduces them to the decimal. Small differences appear in two places, both from Radar's own post-publication revisions rather than any change in method: the crawl-to-refer ratios (June Anthropic now reads ~2,947:1 vs. ~2,978:1 as published; OpenAI ~513:1 vs. ~530:1), and the Workers AI model shares (June BGE-M3 now reads 75.3% vs. 74.8% as published). The robots.txt "June" column is the July 6, 2026 snapshot, matching last edition's snapshot date; its values differ from last edition's published counts by 1–2 domains for the same reason.
One prior-edition caveat is now resolved rather than revised: last month's robots.txt section warned that across-the-board count increases likely reflected a growing parsed sample. Using meta.filesParsed (4,150 → 4,298, +3.6%) that hypothesis can now be tested and rejected — every crawler grew two to five times faster than the sample. The June edition's caution was appropriate on the evidence it had; this edition has better evidence.
Data source: Cloudflare Radar AI Insights and Web Crawlers API endpoints (radar.cloudflare.com), July 6 – August 3, 2026 vs. June 8 – July 6, 2026; robots.txt snapshots August 10 vs. July 6, 2026. Last updated: August 12, 2026.
About the Author: I'm James Bennett, Lead Engineer at WebSearchAPI.ai, where I architect the core retrieval engine enabling LLMs and AI agents to access real-time, structured web data with over 99.9% uptime and sub-second query latency. With a background in distributed systems and search technologies, I've reduced AI hallucination rates by 45% through advanced ranking and content extraction pipelines for RAG systems. My expertise includes AI infrastructure, search technologies, large-scale data integration, and API architecture for real-time AI applications.
Credentials: B.Sc. Computer Science (University of Cambridge), M.Sc. Artificial Intelligence Systems (Imperial College London), Google Cloud Certified Professional Cloud Architect, AWS Certified Solutions Architect, Microsoft Azure AI Engineer, Certified Kubernetes Administrator, TensorFlow Developer Certificate.